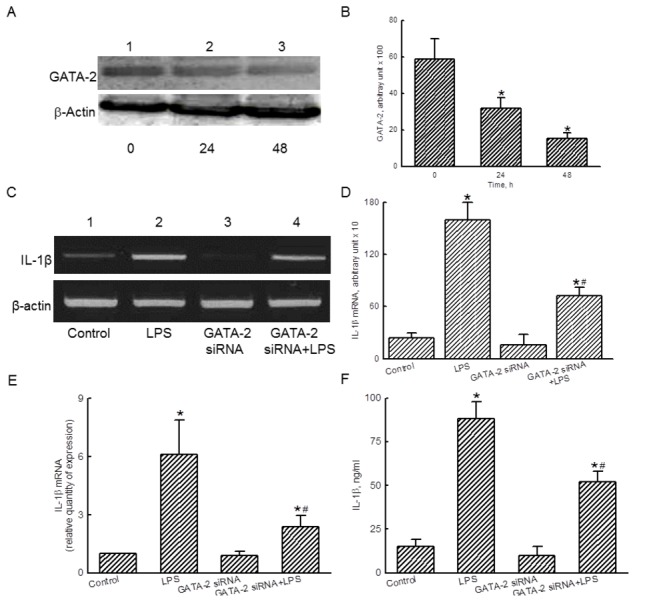
Figure 3. Roles of GATA-2 in lipopolysaccharide (LPS)-induced interleukin (IL)-1β mRNA expression.

RAW 264.7 cells were subjected to GATA-2 small interference (si) RNA for 24 and 48 h. Levels of GATA-2 were immunodetected (A, top panel). β-Actin was measured as the internal control (bottom panel). These protein bands were quantified and statistically analyzed (B). RAW 264.7 cells were exposed to LPS, GATA-2 siRNA, and a combination of GATA-2 siRNA and LPS. Amounts of IL-1β mRNA were determined using an RT-PCR analysis (C, top panel). β-Actin mRNA was analyzed as the internal control (bottom panel). These DNA bands were quantified and statistically analyzed (D). A real-time PCR analysis was conducted to confirm the roles of GATA-2 (E). Effects of GATA-2 siRNA on LPS-induced IL-1β production were determined by ELISA (F). The immunoblotting results shown are a representative of 6 experiments, and the other statistically analyzed results are a compilation of 6 replications. Each value represents the mean ± SD. An asterisk (*) and pound sign (#) indicate that a value significantly (p < 0.05) differed from the respective control and LPS-treated group, respectively.
