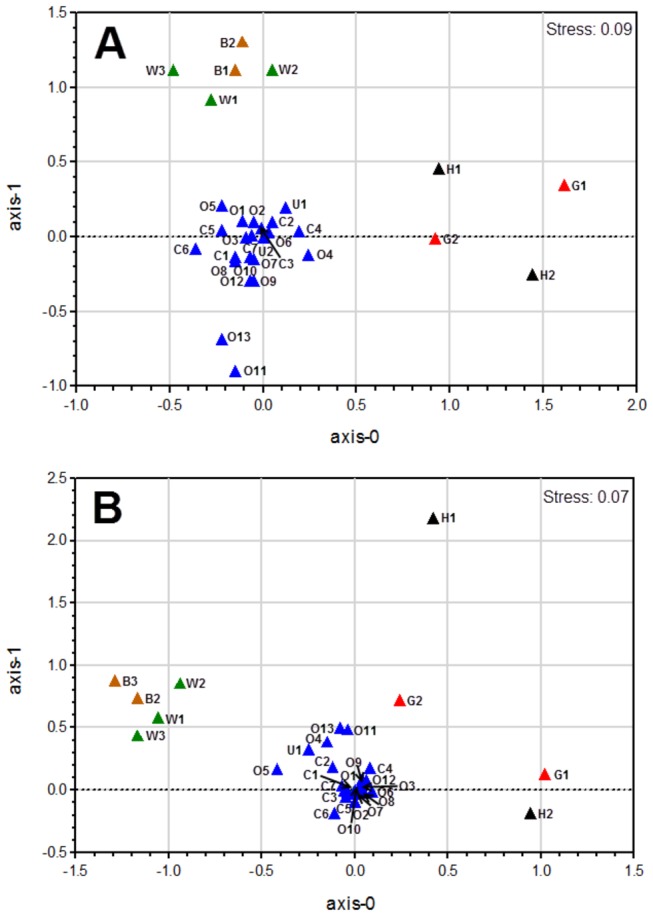
Figure 5. Multidimensional scaling (MDS) plots of samples using Bray–Curtis similarity according to (A) SEED subsystem and (B) Clusters of Orthologous Groups of protein functional annotations.

Color represents different sampling areas and each habitat label type (n) is indicated [G: shallow-sea hydrothermal field (red), H: deep-sea hydrothermal field (black), O: open sea (blue), C: coastal and estuary (blue), U: other habitats in common ocean (blue), B: biofilm (orange), W: whale biofilm (green). For details, see Supplementary Table S2]. Samples from each of the respective environments clustered together based on their functional profile. The stress values are reported in the top right corner of the figures and represent the goodness-of-fit.
