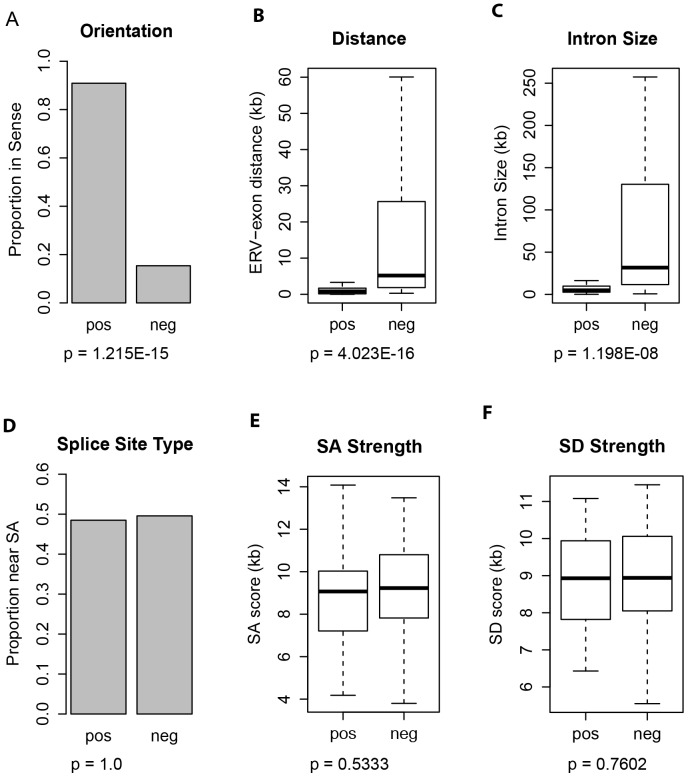
Figure 1. Comparisons of potential factors linked to the likelihood of affecting gene transcription by ERVs.
The name of factors is given above each panel, and the average value of each factor is compared between the positive and negative datasets. Panel A and D are comparisons of proportions using bar plots, and p-values are calculated using the ‘equality of proportions test’; Panel B, C, E and F are comparisons of means using box plots, and p-values are calculated using the ‘Student's t-test’.

