
Figure 3. Distribution of the predicted likelihood of affecting gene transcription by polymorphic ERV insertions.
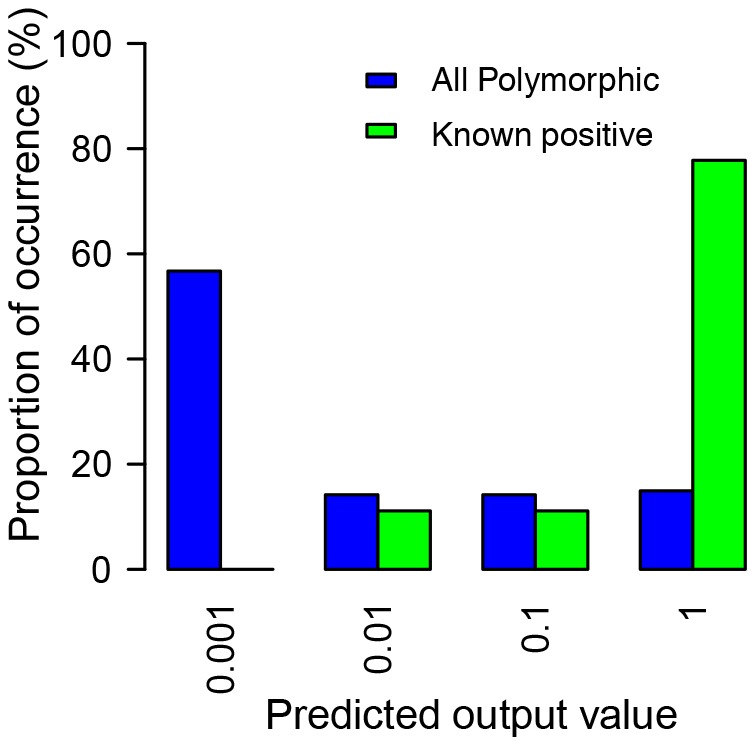
Each bar corresponds to a given range of predicted likelihood of affecting transcription by ERVs, and the height of the bar represents the percentage of ERV insertions with a predicted value within that range. Blue bars represent the distribution of all 134 polymorphic ERV insertions chosen for this study. Green bars represent the distribution of only polymorphic ERV insertions known in the literature as disrupting gene transcription. The ranges of predicted values (horizontal axis) are based on the logarithm scale to increase resolution at the low-end of predicted values.