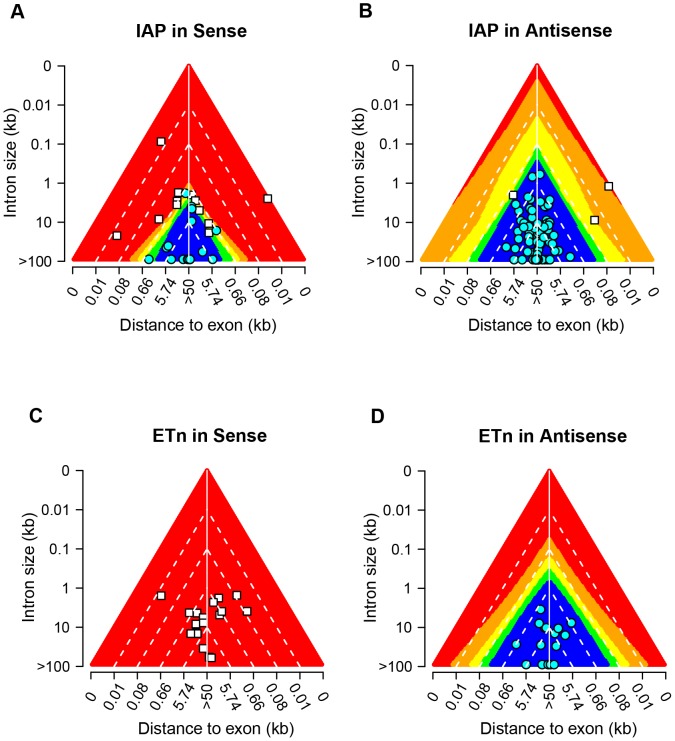
Figure 4. Output space analysis of MLP predictions.
The theoretical output space of the MLP prediction model is plotted separately using in silico ERV insertions for A) IAP in sense, B) IAP in antisense, C) ETn in sense, and D) ETn in antisense. Different ranges of predicted output values are illustrated by a rainbow of colors as shown at the bottom of the figure. For each of the above figure panels, the main triangle plot can be viewed as a stack of ERV-containing introns aligned by their centers, with the horizontal axis showing the distance from a given ERV insertion to its nearest exon. The Vertical axis represents the size of intron, with large introns at the bottom and small ones on top. All known positive (filled circles in cyan) and negative (filled squares in white) cases used for ANN training are also superimposed on top of each plot according to the type and orientation of ERVs.

