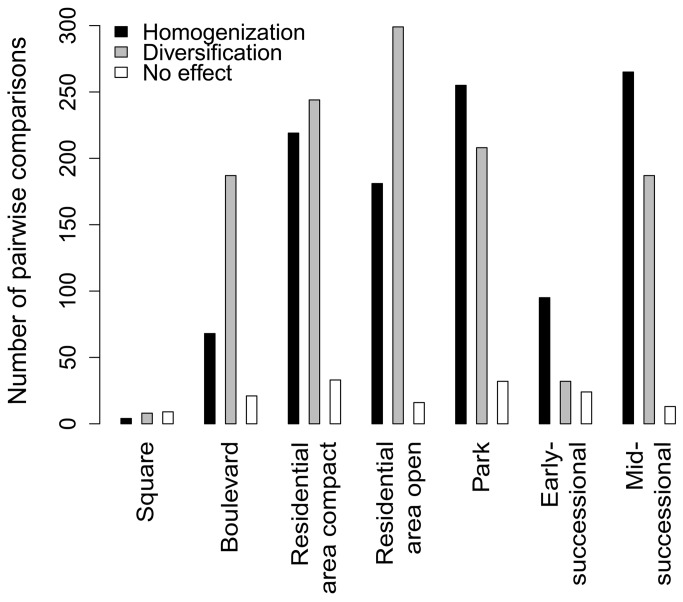
Figure 5. Numbers of positive (homogenization) and negative (diversification) values of the homogenization index resulting from pairwise comparisons among 32 cities and calculated separately for seven types of urban habitats.
Only those plots that harboured four or more species were used, which implies a different number of comparisons for each habitat type: square (4% of all 496 possible pairwise comparisons were considered), boulevard (56%), residential area with open building pattern (100%), residential area with compact building pattern (100%), park (94%), early-successional site (30%), mid-successional site (94%).

