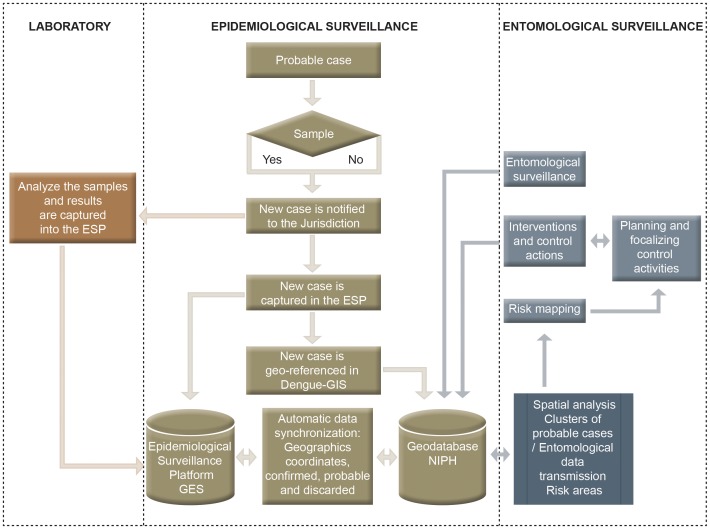
Figure 3. Web-based geographic Information System for integrated dengue epidemiologic surveillance and control data flow diagram.
Epidemiological data on probable case is entered into the system at the health center or sent in paper form to the sanitary jurisdiction where is entered into the EPS system. The case is simultaneously geo-coded and data stored in the geodatabase. Laboratory results from blood samples, taken to a portion of the probable cases, enters the system and serves to update the EPS and Dengue GIS data base. Entomological surveillance data and control activities are entered into the Geodatabase by vector control personnel. The integration of these data is used to produce risk maps.

