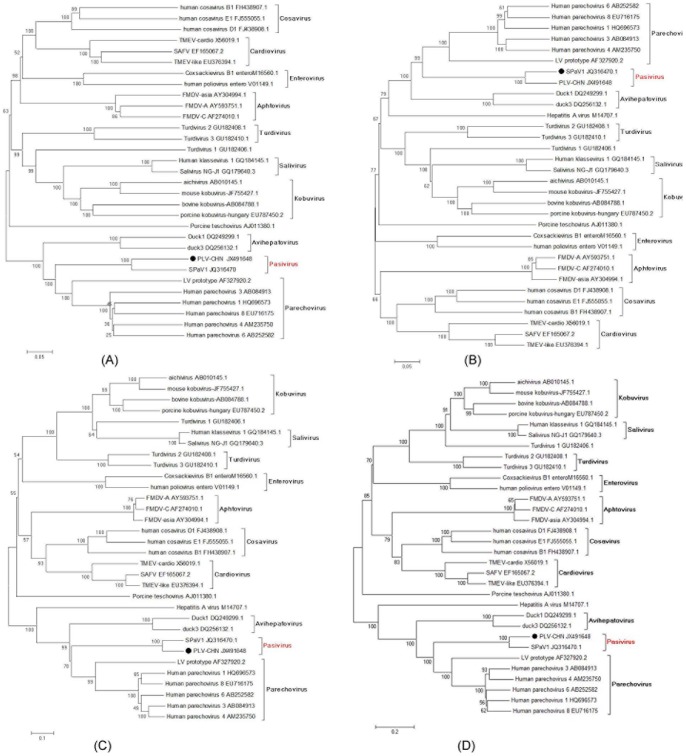
Figure 3. Phylogenetic analysis of nucleotide acid sequences of various PLV-CHN regions.
(A) P1 region (B) P2 region (C) P3 region (D) polyprotein. The tree was constructed using the neighbor-joining method by MEGA ver. 4.1 with 1000 bootstrap replicates. The virus in this study is indicated by “•”. Bootstrap values are shown on the branches.

