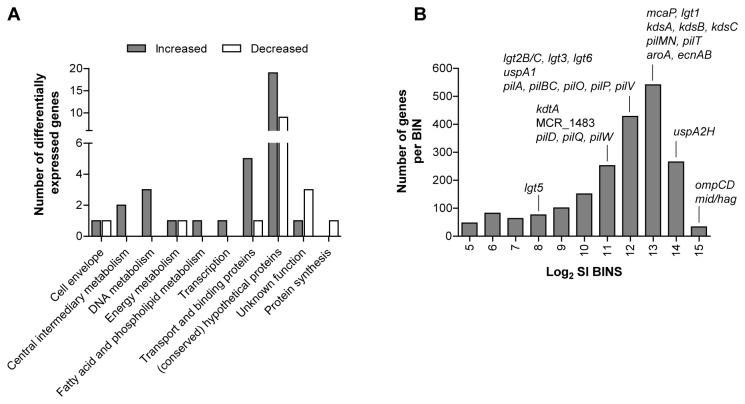
Figure 3. Gene expression of M. catarrhalis BBH18 during adherence to Detroit 562 cells.
A) Functional class distribution of genes differentially expressed in cell-attached relative to non-adherent (planktonic) M. catarrhalis (n = 4), depicted as number of genes per functional class category. B) Distribution of gene expression levels of known adhesins and structural components associated with adherence in cell-attached M. catarrhalis. Average log2 microarrays signal intensities (SI) per gene were grouped into bins (1-log interval per bin), and the total number of genes within a bin is shown here.

