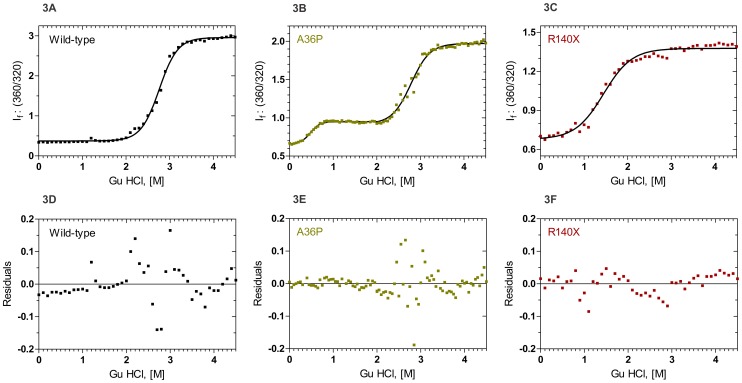
Figure 3. Guanidine hydrochloride (GuHCl) induced denaturation of wild type and mutant γD crystallins.
Samples were excited at 295 nm and the relative emission intensity of the 360 nm band (of the denatured form) was compared to that of the 320 nm band (of the native protein) and monitored as a function of denaturant concentration. Solid line indicates the fitted data and solid blocks stand for raw data. Protein concentration in each sample was fixed at 0.2 mg/ml in 50 mM Tris buffer, 1 mM EDTA and 5 mM DTT. Residuals of wild type and mutant are also shown below the graphs.

