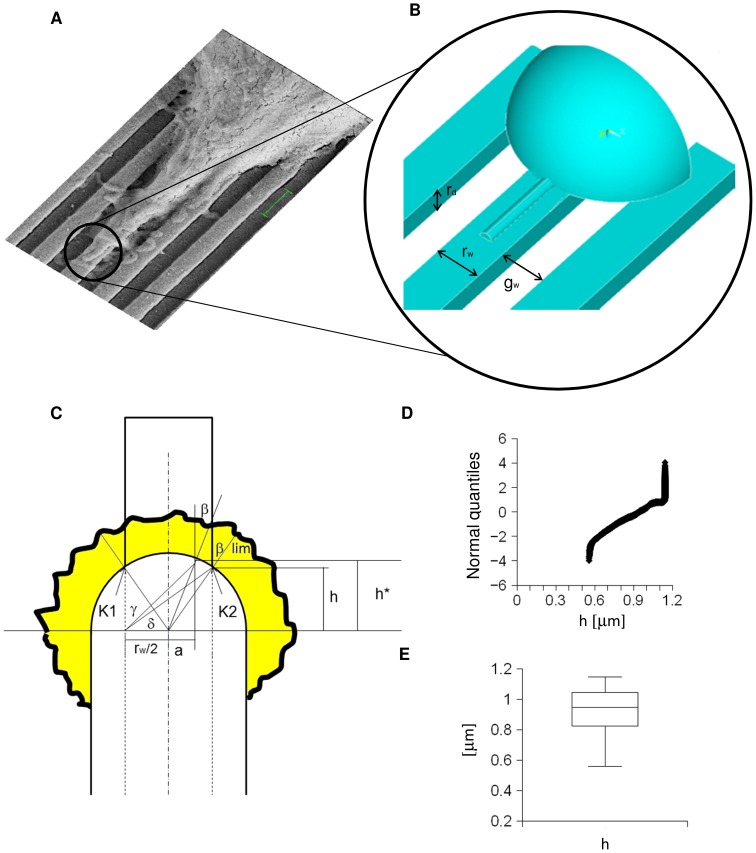
Figure 3. From biological experiments to computational models.
(A) A SEM image of filopodia emerging from a non-spread growth cone (bar = 1 µm). (B) FE model of a non-spread growth cone showing a simplified geometry together with an emerging filopodium. The set of parameters necessary to characterize the nanograting geometry is also shown: ridge width rw, groove width gw, and ridge depth rd. (C) Bidimensional model of interactions between non-spread growth cone and ridge surface. Point K2 (together with K1, symmetric with respect to the centreline of the filopodial shaft) shows the limit angle βlim. The quantity h* was connected to the actual intersection angle through a fraction of the ridge width (a). (D,E) Quantile-quantile plot of the quantity h as derived from in silico simulations, together with its box plot.

