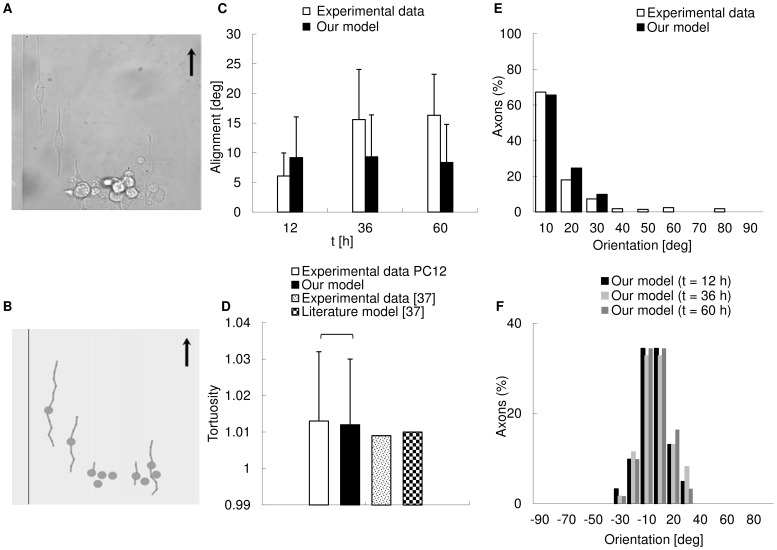
Figure 7. In silico predictions of biological experiments.
(A) DIC image of a cell culture acquired with an inverted Nikon-Ti PSF wide field microscope: PC12 cells were differentiated on a nanograting with period 1 and the black arrow shows the main direction of the grating. (B) Biological experiment (see A) simulated in CX3D. In silico cells were placed on a virtual nanograting with the same geometry of biological experiments and neurites grew according to the framework described by Eqs. (1–4). The black arrow indicates the main direction of the grating. (C) Comparison between biological and in silico alignments. Biological data were collected at t = 12, 36, 60 h, while in silico values were kept at t = 6, 12, 18, 24, 30, 36, 42, 48, 54, 60 h (61 neurites, error bars = standard deviations). Then, the mean biological and in silico values were compared and a Welch t-test resulted in p = 0.3571 (no significant difference). (D) Comparison between experimental, theoretical [37] and in silico mean tortuosity (117 neurites). No significant difference was found in PC12 between experimental and in silico values of tortuosity (Wilcoxon rank sum test, p = 0.2236). (E) Control of neuritic orientation for neurites on a period 1 nanograting in biological experiments [12] and in silico simulations. The percentages of neurites aligned to the grating axis within different angular ranges were reported: in both cases, most of the neurites aligned within 20° with respect to the main grating direction. The range of orientations was similar in both cases. (F) Temporal evolution of orientation control for neurites in CX3D physical space. The orientation of neurites was reported at t = 12, 36 and 60 h and showed small differences over time. Most neurites aligned to the main grating direction within small angular ranges (±20°) for any sampled time.

