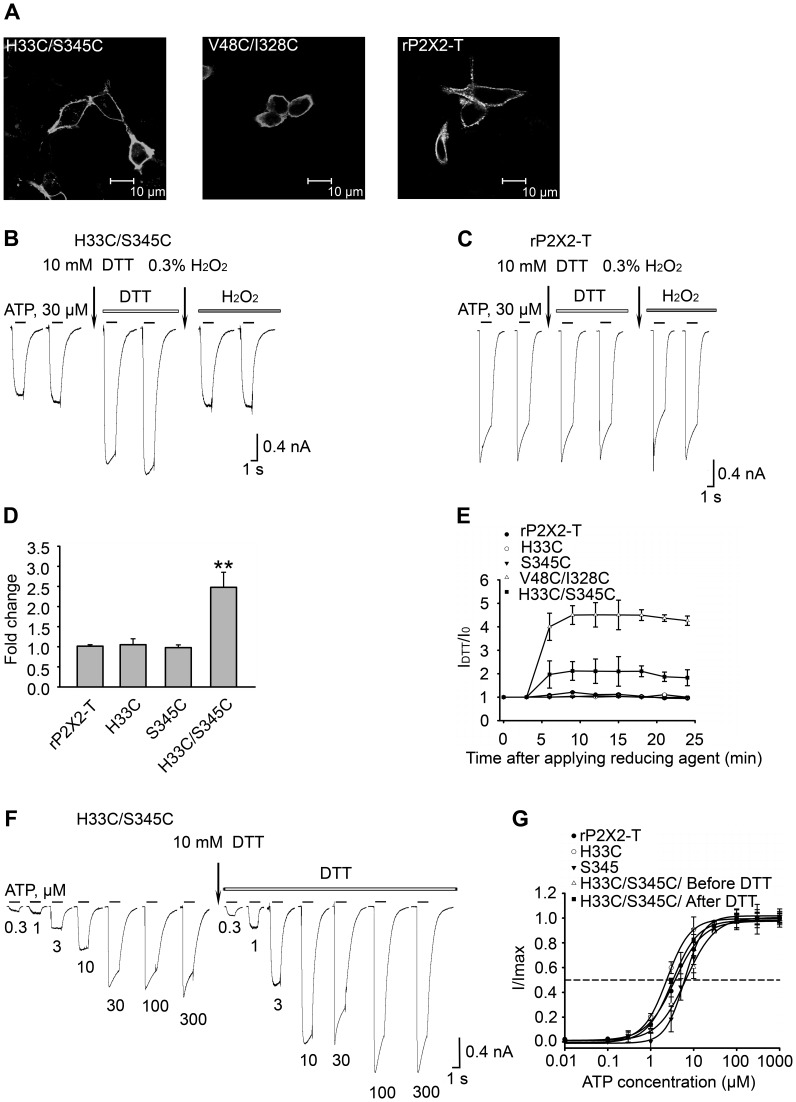
Figure 1. Disulfide bond formation between H33C and S345C alters channel opening.
(A) Subcellular distribution of H33C/S345C (left panel), V48C/I328C (middle panel) and rP2X2-T (right panel) 24 h after transfection in the HEK293 cell line. Scale bar is 10 µm. (B) Effect of DTT and H2O2 on the H33C/S345C double mutant. After two stable responses were evoked by 30 μM ATP (black bar), the cells were incubated in 10 mM DTT for 5 min (first arrow) and were then evoked by 30 μM ATP plus 10 mM DTT (white bar). After stable currents were obtained, cells were incubated with 0.3% H2O2 (second arrow) for 3 min to reverse the effects of DTT, after which the cells were evoked by 30 μM ATP plus 0.3% H2O2 (grey bar). (C) The same protocol was applied to the rP2X2R-T, and had no effect on the responses evoked by 30 μM ATP plus 10 mM DTT. (D) Summary of relative current change in H33C/S345C and rP2X2R-T after DTT application. ** (P< 0.01), the values are significantly different from those obtained for H33C, S345C and rP2X2R-T. (E) Time course of the potentiation of ATP-evoked currents in V48C/I328C (△) and H33C/S345C (▪) double mutants by DTT. rP2X2R-T (•), H33C (○) and S345C (▾) single mutants were not affected by treatment with DTT. (F) Different concentrations of ATP (black bar) evoke currents in H33C/S345C. Each concentration of ATP (indicated below recordings) was applied twice for 2 s with similar results. 30 μM ATP was applied before each test concentration to evaluate rundown. The cell was superfused with 10 mM DTT (indicated by an arrow) for 5 min, and ATP plus DTT (white bar) were then co-applied for 2 s to evoke an inward current. DTT induced changes upon comparison with the control condition. (G) Concentration-response curves generated from the same experiment in (F) for rP2X2R-T (•), H33C (○), S345C (▾), H33C/S345C before (△) and after DTT application (▪). The EC50 curves of single mutant and rP2X2-T after DTT treatment are not shown for the sake of clarity, because there were no significant changes. The dotted line indicates that the value of I/Imax is equal to 0.5. For (D) and (E), all currents were normalised to those measured prior to application of DTT (n = 3-10 cells for each case). For (B), (C) and (F), the gaps indicate 3-min time intervals between each ATP application.

