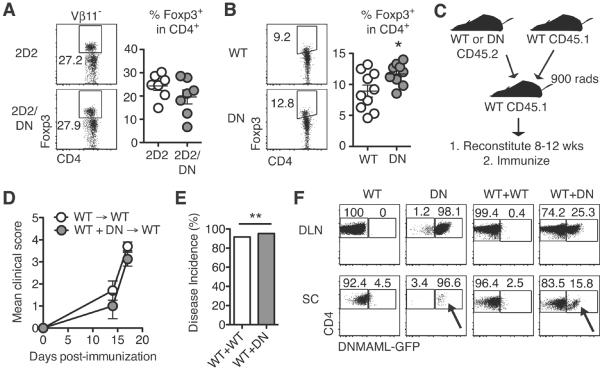
Figure 5. CNS accumulation of DN CD4+ T cells is enhanced in the presence of WT CD4+ T cells, but Notch-deprived CD4+ T cells fail to suppress disease.
Foxp3 expression in (A) Vβ11−CD4+ 2D2/DN and (B) CD4+ DN T cells as assessed by intracellular flow cytometry (n=3–4 mice/group; ≥2 experiments); (C) Experimental design using mixed bone marrow chimeras; (D) Mean clinical score (representative of 5 experiments); (E) Percent disease incidence (score ≥2) of immunized BM chimeras (3 experiments); (F) Representative flow cytometry plots from BM chimeras. T cells were tracked by CD45.1 and CD45.2 expression at peak disease (n=4–5 mice/group; 3 experiments). DLN: draining lymph node; SC: spinal cord. Arrows indicate DNMAML T cells in the CNS, with partial rescue of their accumulation in the presence of wild-type T cells (WT+DN: mixed bone marrow chimeras). p<0.05*; p<0.01**.

