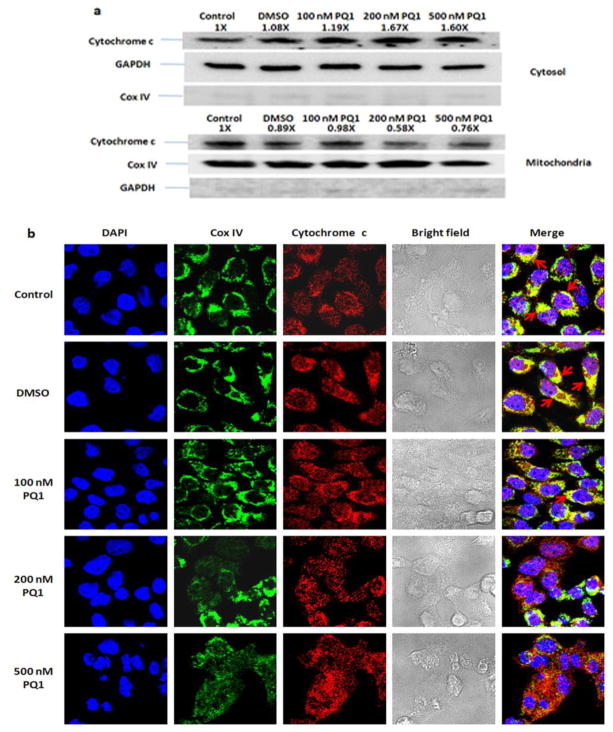
Fig. 6. PQ1 induces the release of cytochrome c from the mitochondira to the cytosol.
T47D cells were treated with DMSO and various concentrations of PQ1 for 48 hours. Cells without treatments were used as controls. (a) Mitochondria and cytosol were separated by using mitochondria isolation protocol as described in Materials and Methods. Western blot analysis of cytochrome c was performed. GAPDH and Cox IV were used as loading control in the cytosolic and mitochondrial fractions, respectively. Cox IV in the cytosol and GAPDH in the mitochondria were used as negative controls. Pixel intensities of protein bands were normalized to pixel intensities of loading controls. The results represent one of three independent experiments. Numbers above the blot show fold changes in expression of cytochrome c normalized to control. (b) Colocalization of cytochrome c and mitochondria was determined by confocal microscopy. Red indicates cytochrome c, green indicates the mitochondrial marker Cox IV, and blue indicates nuclei stained by DAPI. Colocalization of cytochrome c and mitochondria is shown in yellow color as indicated by arrows.

