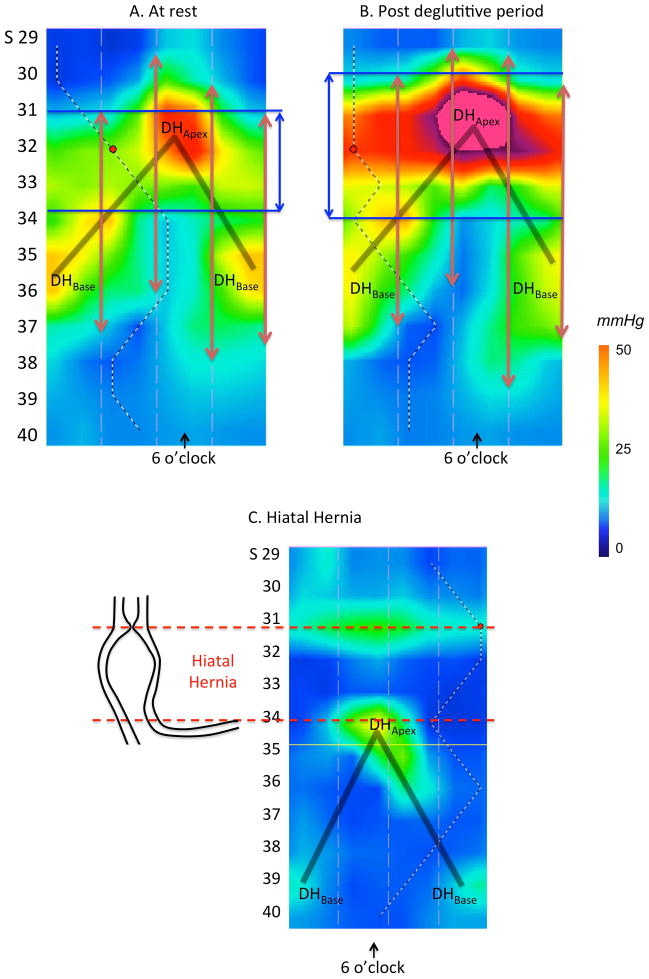
Figure 4.
3D-HRM of the EGJ at rest (Panel A) and in the post-deglutitive period (Panel B). At rest, the inverted V plot reveals the crural diaphragm (DHApex and DHBase) to be the dominant pressure signals while in the post-deglutitive period, the intrinsic LES exhibits a prominent after-contraction, which, in contrast to the crural diaphragm, is circumferential. The vertical red arrows represent the high-pressure zone as determined during station pull-through using sensors radially dispersed at the 3, 6, 9 and 12 o’clock radians and the blue vertical arrows represent the locus of 3D circumferential LES length. Panel C represents the case of a hiatal hernia as seen in 3D-HRM as a confirmation of our findings in normal volunteers. The shaded ‘V’ on the topography plots indicates the disposition of the split diaphragm signal.

