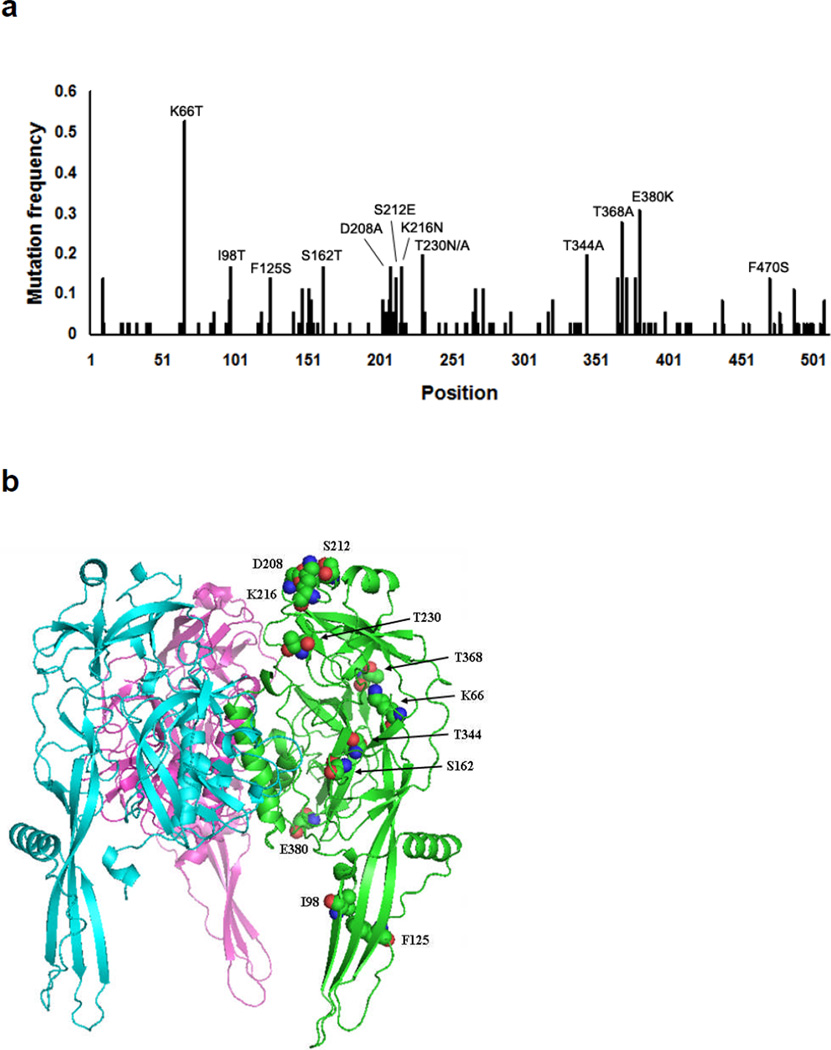
Figure 1. Common mutations following directed evolution of VSV-G.
(a) The frequency of mutation at each amino acid residue of VSV-G among 36 randomly chosen VSV-G clones after 5 or 6 selection steps. (b) The location of each apparent ‘hot spot mutation’ in the crystal structure of the prefusion form of VSV-G (PDB ID: 2J6J). Figure was made using PyMol (http://www.pymol.org). Each monomer of VSV-G was colored in green, purple, and sky-blue, respectively. Green, blue, and red balls represent carbon, nitrogen, and oxygen atoms, respectively.

