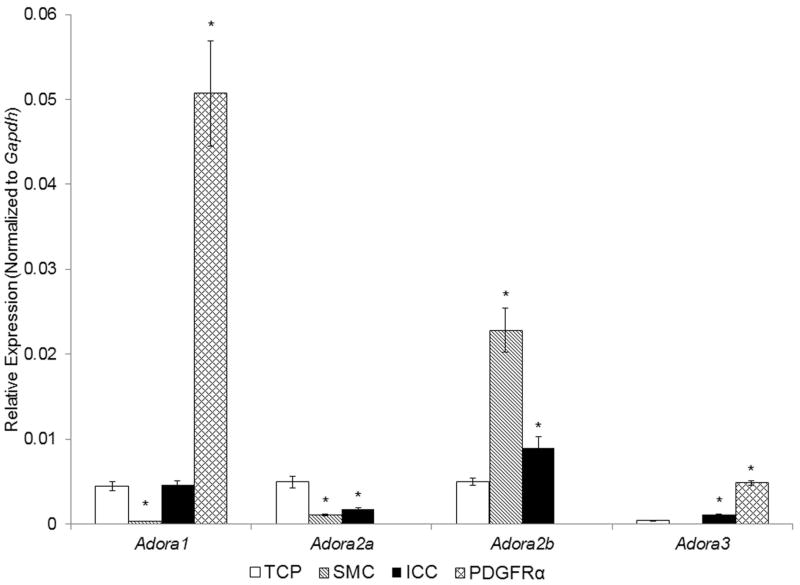
Fig. 2. Expression of genes for P1 receptors in SMC, ICC, and PDGFRα+ cells of the murine colon by qRT-PCR analysis.
Note that SMC and ICC were enriched with Adora2b, whereas PDGFRα+ cells were enriched with Adora1 and Adora3. TCP, total cell population (n=6), Sorted SMC, ICC and PDGFRα+ cells (each n=3). Asterisks indicate P<0.05 when compared to the transcript isolated from TCP.

