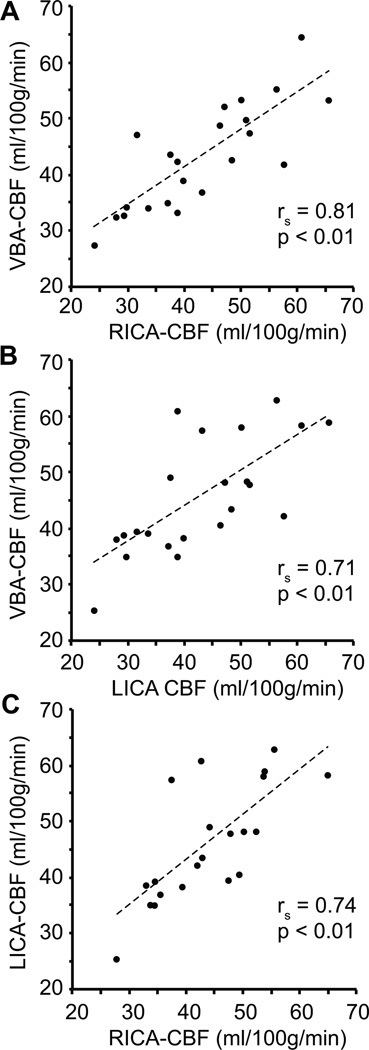
Figure 5.
Correlation plots between the cerebral blood flow (CBF) measured from different flow territories (VBA: vertebrobasilar artery; RICA: right internal carotid artery; LICA: left internal carotid artery) for all volunteers (n=22). These data demonstrate that on average CBF values are highly correlated between different flow territories, although the extent of each flow territory varies between volunteers (e.g., Figure 6). The Spearman rank correlation coefficient (rs) and corresponding one-sided p-values are shown as well.

