Abstract
Purpose
To evaluate a method to enable single-slice or multiple-slice cine phase contrast (cine-PC) acquisition during a single breath hold using a highly sparsified radial acquisition ordering and temporally constrained image reconstruction with a spatially varying temporal constraint.
Materials and Methods
Simulated and in-vivo cine PC data sets of the proximal ascending aorta were obtained at different acceleration factors using a view projection acquisition order optimized for temporally constrained reconstruction (TCR). Reconstruction of the sparse cine-PC data performed with TCR was compared to reconstructions using zero-filled ergridding and temporal interpolation.
Results
TCR resulted in more accurate velocity measurements than regridding or temporal interpolation. In one data set, TCR of under-sampled in-vivo data (16 views per cardiac phase) resulted in a PSV within 3.3% of the value measured by Doppler ultrasound while shortening the scan time to 13 seconds. High temporal-resolution under-sampled TCR was also compared lower temporal-resolution, more highly-sampled, regridding in 3 normal volunteers.
Conclusion
TCR proved to be an effective method for reconstructing under-sampled radial PC data. Although TCR utilizes a temporal constraint, temporal blurring was minimized by using appropriate constraint weights in addition to a spatially varying temporal constraint. TCR allowed for the acquisition time to be reduced to the duration of a breath hold, while still resulting in accurate velocity measurements.
Keywords: constrained reconstruction, iterative reconstruction, phase-contrast
INTRODUCTION
PC Imaging
Cine phase-contrast (PC) imaging is an important MRI technique for measuring in-vivo blood velocities ((1–3)). Unfortunately, PC scan times are intrinsically long because they require the acquisition n + 1 data sets, where n is the number of velocity directions measured. Furthermore, cardiac PC imaging is affected by respiratory motion. Navigator echoes or breath-hold acquisitions are frequently used to avoid motion artifacts ((4–6)), but both of these techniques have negative consequences. Navigator echoes drastically increase scan time because data are only acquired during times when the heart position is sufficiently consistent. Breath-hold acquisitions can be performed rapidly, but are limited to the duration of a breath hold, which places limits on the spatial and temporal resolution and total coverage of the acquisition, which are important for accurate velocity measurements. In order to allow for accelerated PC acquisitions with high temporal and spatial resolution, techniques that can reconstruct highly accelerated (sparsified) PC acquisitions, while still maintaining temporal resolution, are needed.
Accelerated PC
Several techniques have been previously used to accelerate cine PC imaging. Nearly all of these techniques involve under-sampling the measurements in each time frame of each image slice and then using one of a number of different techniques to reconstruct images from these under-sampled data sets. Parallel image reconstruction methods, such as GRAPPA and SENSE, use the independence of the RF receiver coil sensitivities to provide extra information from which the missing measurements can be predicted. Because of the limited number of coils and the fact that the coil sensitivities are not completely independent, parallel image reconstruction methods are generally limited to low acceleration factors (R=2 or R=3) ((7,8)). By also taking advantage of correlations in time, various “k-t” methods, including k-t BLAST/SENSE and k-t GRAPPA, have been able to reconstruct sparse measurements with higher acceleration factors ((9–11)). These k-t methods can achieve higher acceleration factors, but they can suffer from temporal blurring and often require additional training data.
Image reconstruction methods which rely on correlations in time to fill in missing k-space data are based on the assumption that image space varies slowly in time. When this assumption is accurate, and only stationary or slowly varying tissues are imaged, high acceleration factors can be achieved without negative consequences. When, however, this assumption is not correct and quickly varying tissues are being imaged, high acceleration factors can lead to temporal blurring, even though much of the under-sampling artifact (in x and y) may be removed.
TCR
Recently, the use of temporally constrained reconstruction (TCR) for reconstructing highly under-sampled cine data has been demonstrated. TCR is an iterative technique that generates an image estimate based on the minimization of a cost functional containing a fidelity term and a temporal constraint term. The temporal constraint is tunable and can be adjusted to minimize temporal blurring. Additionally, the temporal constraint can be spatially dependent, allowing stationary regions of the image to be more temporally constrained than non-stationary regions, improving the results. Adluru et al. recently applied TCR to highly under-sampled cardiac perfusion data ((12,13)). TCR is a promising technique for accelerating PC imaging, but its ability to reconstruct PC data has not yet been evaluated.
Objectives
The purpose of this study was to: 1) compare velocity measurements reconstructed with TCR to simple temporal interpolation of k-space, using retrospectively under-sampled simulated data, 2) compare image quality and peak systolic velocity (PSV) measurements reconstructed with TCR to fully sampled in-vivo data and Doppler ultrasound, and 3) determine if TCR can be used to reduce the acquisition time of a high-resolution cine PC sequence enough to be performed during a short breath hold, while still resulting in accurate velocity measurements.
METHODS
MRI Studies
Data Acquisition
All data was acquired using a cine radial spoiled gradient echo PC pulse sequence. Radial data was read-out in a symmetric fashion with the center of each readout positioned at the center of k-space. Radial views were distributed equally over 180° for each cardia phase. The acquisition pattern was offset between cardiac phases so that sampling patterns for neighboring phases overlapped as little as possible while still ensuring maximal combined k-space coverage across all cardiac phases. The acquisition pattern was rotated between cardiac phases according to equation 1 where ϕp,even is the sampling pattern rotation for even numbered cardiac phases and ϕp,odd is the rotation for odd numbered cardiac phases, p is the cardiac phase number, and nv and np are the total number of radial views and cardiac phases respectively.
| [1] |
Three types of data sets were collected. First, three highly-sampled data sets (128 views) were acquired from three different subjects and retrospectively under-sampled. Peak systolic velocity (PSV) measurements from the original data were compared to PSV measurements from the under-sampled data, reconstructed with temporal interpolation and TCR. Second, two in-vivo data sets were acquired from the same subject, a highly sampled set with 192 views per cardiac phase (acquisition time: 70 seconds) that was reconstructed with standard methods (called Standard-192), and prospectively under-sampled data set with 16 views per cardiac phase (acquisition time: 13 seconds) which was reconstructed with TCR (called TCR-16). PSV measurements from Standard-192 and TCR-16 were compared to the PSV measurement obtained by echocardiogram. Third, in 5 normal volunteers a high temporal-resolution under-sampled (16 radial views) TCR reconstruction was compared to a separate low resolution more fully-sampled (128 radial views) zero-filled re-gridded reconstruction. Volunteers were asked to hold their breath during each acquisition. The under-sampled data set obtained 16 radial views per cardiac phase, took between 15 and 19 seconds depending on heart rate, and the temporal resolution was 19 ms. The more fully sampled data set obtained 128 radial views per cardiac phase, took 24 to 27 seconds, depending on heart rate, and the temporal resolution was 79 ms. One subject was excluded due to a physiological finding during the exam that compromised the repeatability of the flow measurements and another subject was excuded due to poor image quality.
With informed consent and an IRB approved protocol, all subjects were imaged on either a Siemens Magnetom Verio 3T or a Magnetom Trio Tim 3T MRI scanner (Siemens Healthcare, Erlangen, Germany), using a standard Siemens chest/spine coil, the scanner automatically selected the optimal channels which were combined into 5 virtual channels. A single axial slice, positioned at the base of the ascending aorta, was acquired and velocity was measured in the through-plane direction. The acquisition matrix was 192 × 192 with a voxel size of 1.56 × 1.56 mm2 and a slice thickness of 5 mm. Other parameters were TR/TE/α = 24.0ms/4.0ms/15° on the Verio and TR/TE/α = 36.2ms/6.7ms/15°, with a VENC = 150 cm/s being used on both. The sequence was gated to the cardiac cycle using either ECG leads or a pulse oximeter placed on the subject’s finger.
Simulated, Under-sampled Data
To generate new radial measurements, for the retrospectively under-sampled data, the fully-sampled data was first interpolated to the Cartesian coordinate system and transformed to the image domain. Then a complex radon transform, followed by a transformation back to k-space, was used to generate new radial measurements that were then re-sampled to 192, 32, 16, and 8 radial views. This was done so that arbitrary view angles could be generated in order to conform to the under-sampling scheme used.
TCR Implementation
Interpolation onto Cartesian Grid
Initially, all radial data was interpolated onto a Cartesian coordinate system using a bilinear interpolation. Data remained in the Cartesian coordinate system for all subsequent operations.
Cost Functional
The TCR cost functional, C(m̃), used in this paper is shown in equation 2.
| [2] |
W is the under-sampling pattern, S is the relative coil sensitivity,
 is the 2D Fourier transform, and m̃ is the image estimate, λ is a tunable parameter, which can also depend on position in the image, dc is the original measurement data for receiver channel c, · is the piecewise multiplication operator, and ∇t is the temporal gradient. An L1 norm was used for the temporal constraint instead of an L2 norm in order to preserve sharp changes in the temporal velocity profile, or in other words, to reduce temporal blurring.
Coil Sensitivity Estimation
A single set of coil sensitivity estimates was calculated and used for reconstructing each individual cardiac phase. Assuming that signal variations through the cardiac cycle are relatively small, the k-space measurements in a single data set were averaged across all cardiac phases to get a more complete set of k-space. Then, this data was inverse-Fourier transformed to the image domain and sensitivity estimates were calculated by dividing individual coil signals by the sum-of-squares combination of all coil signals, as described in equation 3, where m̄c is the image data reconstructed from the time-averaged k-space data for the channel c.
| [3] |
Initial Image Estimate
As an intermediate step toward generating the initial image estimate (m̃0), the measured k-space data (d) was temporally interpolated to fill in missing values, and then inverse-Fourier transformed to the image domain to form a vector of images, m̂, one for each receiver coil. Due to the inclusion of the coil sensitivity term in the TCR reconstruction, m̃0 could not have a channel dimension, so the channels in m̂ needed to be combined. Image phase is essential to the PC reconstruction so the combination method chosen to form m̃0 from m̂ needed to preserve the phase difference between the reference and velocity-encoded (VE) sets. The phase difference ( ) was calculated from m̂ using the two-point method, where the velocity is determined to be proportional to the phase difference of the reference and VE sets, and the phase differences from all the input channels were combined using the weighted-sum method described in equation 6 to yield . Finally, the magnitudes of the reference and VE sets of m̃0 were set to the sum-of- squares combination of the reference and VE sets of m̂. The VE set of m̃0 was multiplied by to restore the phase difference between the two sets. This resulted in an initial image estimate that had a reference set with zero phase and a VE set with a phase corresponding to the calculated phase difference of m̂.
| [4] |
| [5] |
PC Channel Combination
Multi-channel phase-contrast data cannot be combined using the standard sum-of-squares approach due to the importance of the image phase. For this work, the weighted sum method was used ((14)). The phase-difference was computed using the two-point method for each channel individually, and then phase differences were combined as a weighted sum with weights corresponding to the square of the magnitude image (mi) divided by the variance of the coil noise (σi):
| [6] |
Spatially Varying Temporal Constraint (λ)
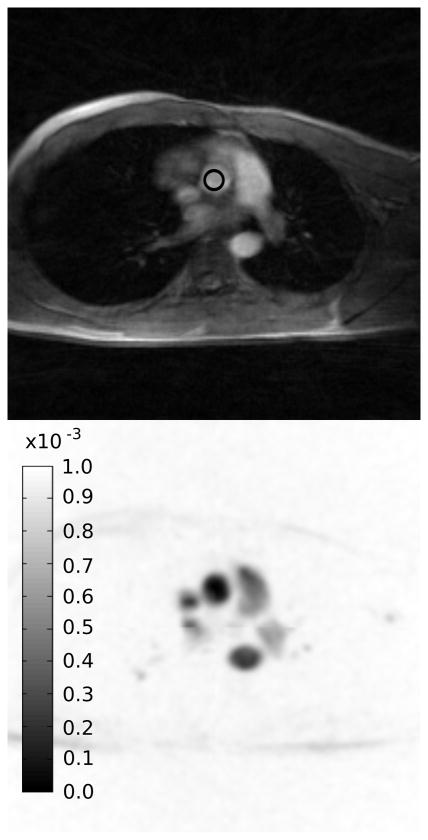
A spatially varying temporal constraint weight was used to constrain areas with low or no flow more than areas with flow. An initial map (Λ) was derived from the initial image estimate m̃0 by computing the magnitude of the complex difference of the VE and reference sets, of the initial image estimate, m̃0 and summing in the cardiac phase dimension. This resulted in a map with high values in locations with high flow and low values where little or no flow existed. This map was then inverted and normalized to a pre-specified λmax to get λ An example lambda map is shown in Figure 1. The value of λmax used in this work was determined empirically by reconstructing a retrospectively under-sampled data set with a range of different λmax values and selecting the value that minimized the RMSE of the max velocity curve with respect to the fully sampled data.
Figure 1.
Magnitude image (top) and the corresponding spatial lambda map (bottom). Dark areas in the map are less temporally constrained. The ROI used to measure velocities is indicated by the black circle in the magnitude image.
| [7] |
| [8] |
Non-linear Gradient Descent Minimization
The cost functional (equation 2) was minimized by an iterative gradient descent algorithm. The gradient of the cost functional (equation 3) was calculated at each iteration and subtracted from the current image estimate; the result was used as the image estimate in the next iteration. The L1 norm is not differentiable at zero so in order to calculate the gradient an approximation of the L1 norm was used instead, which included a small offset (β2) to make it differentiable at zero.
| [9] |
Analysis
For the simulated data, velocities were measured inside a circular region of interest (ROI) inside the proximal ascending aorta (Figure 1). The position of the ROI was adjusted for each cardiac phase so that it remained at the center of the aorta. These ROIs were used to calculate PSV measurements, generate velocity curves, and correlation plots in a pixel-wise fashion over all cardiac time frames. For the in-vivo data, images were reconstructed and visually inspected to assess the difference in image quality. Additionally, an ROI was used, as with the simulated data, to calculate PSV measurements which were compared to Doppler ultrasound.
RESULTS
Simulated Data
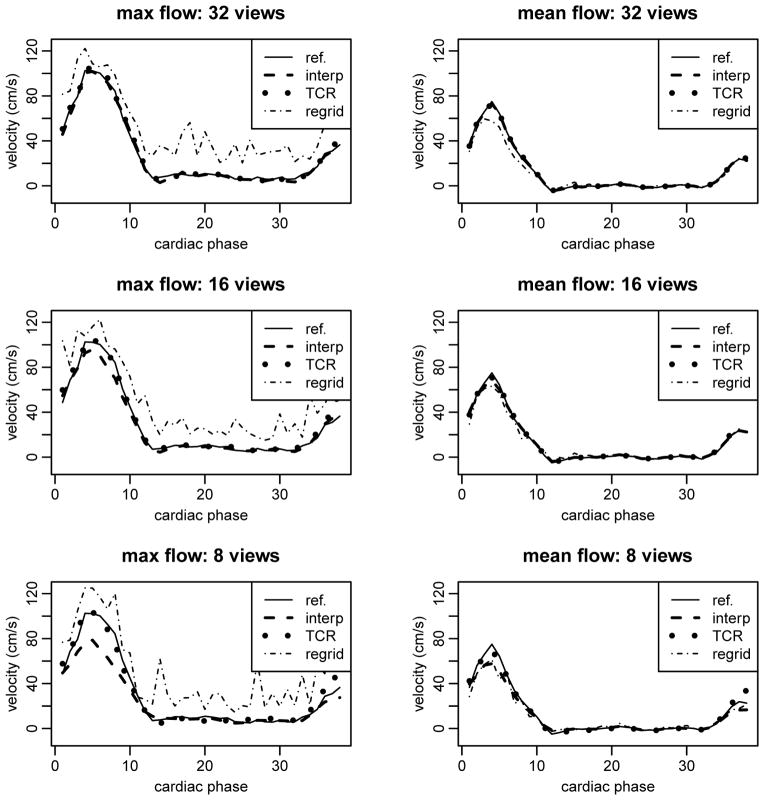
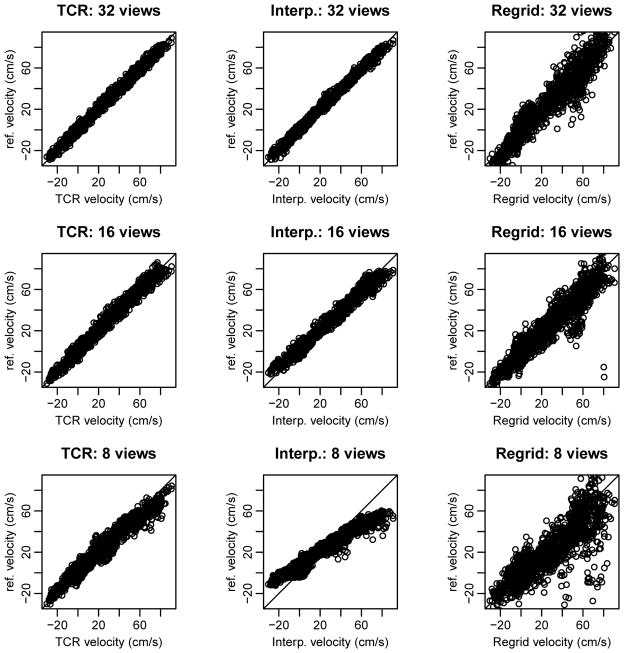
Max and mean velocity curves for one simulated data set are shown in Figure 2. At 32 radial views the velocity curves from both temporal interpolation and TCR match closely with the reference curve. Temporal blurring is evident in the temporal interpolation curves; this blurring gets worse as the number of radial views is decreased. Table 1 outlines the PSV values and % errors computed for each of the simulated data sets with different under-sampling factors. TCR resulted in PSV values with small error even at high under-sampling factors while temporal interpolation resulted in more inaccurate PSV values as the number of radial views was decreased. Temporal interpolation did however produce PSV values with small errors at 32 radial views. A correlation plot from one of the simulated data sets, with different acceleration factors, is shown in Figure 3 and correlation parameters are shown in Table 2. The plots suggest that at 32 radial views both TCR and temporal interpolation correlate well with the reference data. As the number of radial views is decreased, temporal interpolation shows signs of temporal blurring and high velocities are under-estimated, while low velocities are over-estimated.
Figure 2.
Velocity curves for one of the simulated data sets. Temporal interpolation results in significant temporal blurring, especially at higher acceleration factors.
Table 1.
PSV measurements (in cm/s) of the simulated data with varying levels of under-sampling compared to the fully-sampled reference measurements.
| views | SIM3 (102.5) | SIM1 (90.7) | SIM2 (69.0) |
|---|---|---|---|
| TCR (err%) / interp (err%) | TCR (err%) / interp (err%) | TCR (err%) / interp (err%) | |
| 32 | 106.0 (3.4%) / 101.7 (0.8%) | 88.5 (2.5%) / 86.8 (4.4%) | 71.7 (3.9%) / 66.9 (3.1%) |
| 16 | 106.0 (3.4%) / 101.7 (0.8%) | 87.6 (3.5%) / 78.8 (13.2%) | 66.4 (3.9%) / 61.9 (10.4%) |
| 8 | 109.5 (6.9%) / 78.6 (23.3%) | 87.8 (3.2%) / 60.2 (33.7%) | 66.6 (3.5%) / 52.4 (24.1%) |
Figure 3.
Correlation plots for one simulated data set under-sampled to 32, 16, and 8 radial views. Plots for TCR are shown on the left, plots for temporal interpolation are shown in the middle, and plots for zero-filled re-gridding are shown on the right. TCR maintains better correlation than temporal interpolation as the number of radial views is decreased, both show better correlation than simple re-gridding.
Table 2.
Correlation parameters correlation coefficient R2 for correlation plots shown in Figure 3.
| Data Set | slope, intercept | R2 | ||
|---|---|---|---|---|
| Interp. | TCR | Interp. | TCR | |
| SIM1: 32 v. | 1.00, −0.0013 | 0.99, 0.0023 | 0.9925 | 0.9884 |
| 16 v. | 0.97, 0.0070 | 0.99, 0.0019 | 0.9783 | 0.9798 |
| 8 v. | 0.79, 0.0455 | 0.94, 0.0169 | 0.9457 | 0.9541 |
|
| ||||
| SIM2: 32 v. | 0.98, 0.0065 | 0.98, 0.0100 | 0.9916 | 0.9896 |
| 16 v. | 0.94, 0.0205 | 0.99, 0.0063 | 0.9758 | 0.9808 |
| 8 v. | 0.69, 0.0940 | 0.88, 0.0319 | 0.9384 | 0.9586 |
|
| ||||
| SIM3: 32 v. | 0.98, 0.0043 | 0.99, 0.0050 | 0.9856 | 0.9831 |
| 16 v. | 0.92, 0.0232 | 0.98, 0.0145 | 0.9736 | 0.9731 |
| 8 v. | 0.73, 0.0299 | 0.93, 0.0144 | 0.9307 | 0.9428 |
In-vivo Patient Data
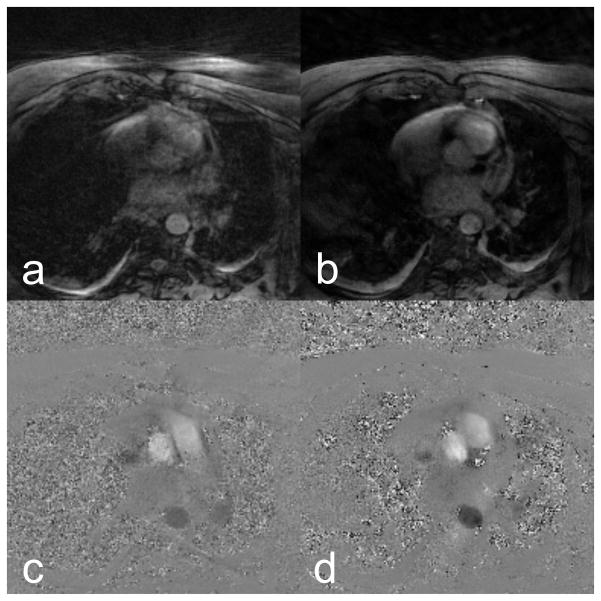
Magnitude and phase reconstructions for a single phase of TCR-16 are compared to the reconstructions from Standard-192 in Figure. Even though the Standard-192 data was reconstructed from more views, the image quality is much poorer than the TCR-16 data. The subject imaged had difficulty holding still and holding his breath, which was the likely cause for the difference in image quality. Motion artifacts are evident in the Standard-192 data but the TCR-16 images are much clearer. The Standard-192 PC images show signs of velocity underestimation in the ascending and descending aorta. An echocardiogram indicated that the PSV in the ascending aorta was 125 cm/s. TCR-16 indicated a PSV of 121 cm/s (3.3% error) while Standard-192 indicated a PSV of 107 cm/s (17% error).
In-Vivo Healthy Volunteer Data
Velocity histogram plots (Fig 4) were used to compare the under-sampled TCR data with the more fully sampled, regridded zero-filled data. The difference in temporal resolution is obvious, but both TCR and regridding indicate similar PSV values. TCR data was acquired with only 16 radial views as opposed to the regridded data which was acquired with only 128 radial views, at a lower temporal resolution, which was necessary to allow for a breath hold scan time around 30 seconds.
Figure 4.
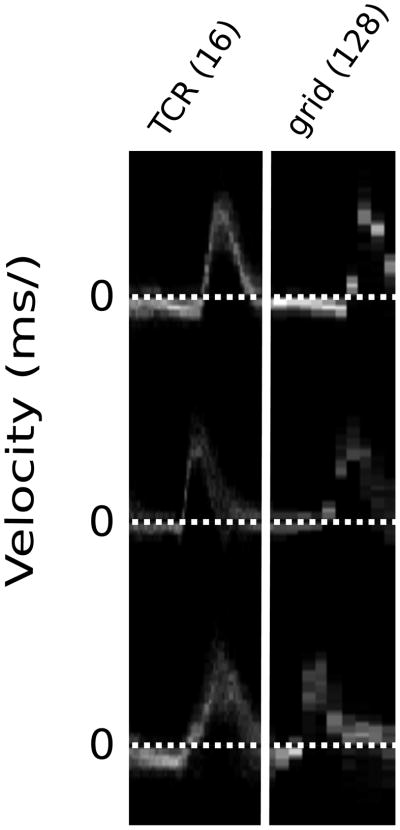
Velocity histogram plots for 3 healthy volunteers from a ROI at the center of the proximal ascending aorta. High temporal-resolution TCR (left) is compared to low temporal-resolution gridding (right).
DISCUSSION
The purpose of this study was to assess the feasibility of using TCR to reconstruct highly under-sampled cine PC data. Using an appropriate radial view-order sampling pattern, TCR was applied to both simulated and in-vivo data and the results were compared to a simple temporal interpolation of k-space. PSV measurements from the in-vivo MRI data were compared to Doppler ultrasound.
Results from the three simulated data sets showed that TCR produced more accurate velocity curves than temporal interpolation, which exhibited significant temporal blurring at high acceleration factors. However, with 32 views per cardiac phase, the performance of temporal interpolation was similar to TCR. This is most likely due to the high temporal resolution of the simulated data. Other experiments showed that temporal interpolation results in more significant temporal blurring when the temporal resolution of the measurement data is reduced. With 16 and 8 radial views per cardiac phase, TCR outperformed temporal interpolation, resulting in more accurate velocity curves and PSV measurements. With 8 radial views, PSV measurements from TCR remained within 3–7% of the reference PSV, but temporal interpolation produced much larger PSV errors within the range of 23–34%.
Results from the in-vivo data suggest that TCR of under-sampled data can produce better images and PSV measurements than standard reconstruction of more fully sampled data when subject motion, respiratory or otherwise, is a problem. TCR resulted in fewer motion artifacts and measured a PSV that was within 3.3% of the PSV measured by Doppler ultrasound. The highly sampled in-vivo data set was acquired with a large number of radial views (192) in order to avoid under-sampling artifacts. This subject had difficulty holding still, and moved enough during the longer Standard-192 scan time to cause significant motion artifacts in the reconstructed images. However, the TCR-16 acquisition was short enough to be acquired without too much subject motion and the resulting images were free from motion artifacts. Image quality is highly dependent on subject compliance, and long scan times do not necessarily result in motion artifacts, but a decreased scan time lessens the risk of motion artifacts. In this instance, TCR allowed the scan time to be reduced to 13 seconds, which is within the duration of a breath hold for most subjects.
Temporal blurring is a potential issue for any reconstruction technique that relies on signal correlations in time to reconstruct under-sampled data. TCR has several advantages that allow it to reconstruct data without significant temporal blurring. Coil sensitivity information was incorporated into the TCR fidelity term, adding a parallel imaging aspect allowing for the filling in of missing k-space values based on the coils sensitivities. With the inclusion of the coil sensitivity information in the fidelity term, TCR is essentially an iterative SENSE reconstruction ((15)) with an added temporal constraint. Additionally, the temporal constraint in TCR is tunable and spatially varying, with areas of flowing blood being less temporally constrained than static tissues.
A relatively small number of receiver channels were used in this work. The coils used in these experiments can be set to output uncombined data from each channel, resulting in 3 times more receiver channels. Increasing the number of channels would likely improve TCR image reconstruction, but this has not yet been explored. Additionally, a relatively simple method for determining coil sensitivities was used. A different method may have produced more accurate sensitivity maps and improved the TCR reconstructions.
A radial acquisition scheme was used for two primary reasons. First, the PSF of a radial sampling pattern spreads artifact in multiple directions creating less coherent artifacts. These less coherent artifacts. These less coherent artifacts can be more effectively resolved by TCR than the aliased image replicates created by Cartesian under-sampling. Second, a radial acquisition oversamples the center of k-space, ensuring that the under-sampled data has increased sampling density at the center of k-space. The sampling pattern selected was used so that aliasing patterns would be different between cardiac phases, making the data better conditioned for correction by a temporal constraint. Additionally, this ensured that there would be enough information to generate good coil sensitivity maps, as these were generated from the combined data of all cardiac phases. Radial data was transformed to the Cartesian coordinate system as a first step. An alternative to this approach would be to use a non-uniform FFT (NUFFT) to transform the data from radial to Cartesian at each iteration. However, However, NUFFT is more computationally expensive than a traditional FFT because it performs a convolution step in addition to an FFT step. If NUFFT were used instead of pre-gridding of the initial data, a NUFFT and an inverse NUFFT would need to be performed at each iteration instead of a FFT and an IFFT and this would have added a significant amount of computation time.
In conclusion, TCR was able to reconstruct highly under-sampled cine PC data. Results from simulated and in-vivo data indicate that TCR produced more accurate velocity measurements than temporal interpolation and zero-filled regridding and has the ability to improve image quality over more highly sampled data when subject compliance is an issue. TCR allowed for a single-slice single-velocity cine-PC acquisition in 13 seconds which resulted in a measured PSV similar to the PSV measured by Doppler ultrasound.
Figure 5.
Magnitude and PC reconstructions of an in-vivo data. The 192 view data reconstructed using standard methods is shown in a and c. The under-sampled 16 view data reconstructed with TCR is shown in b and d. Motion artifacts, most likely due to respiration, are evident in the 192 view data and the image quality of the 16 view data is much better.
Acknowledgments
Grant Support: NIH R01 HL48223, NIH R01 HL57990, Siemens Medical Solutions, the Mark H. Huntsman Endowed Chair, NLM training grant LM007124, and the Ben B. and Iris M. Margolis Foundation.
REFRENCES
- 1.Meier D, Maier S, Bosiger P. Quantitative flow measurements on phantoms and on blood vessels with MR. Magn Reson Med. 1988;8(1):25–34.s. doi: 10.1002/mrm.1910080104. [DOI] [PubMed] [Google Scholar]
- 2.Firmin DN, Nayler GL, Klipstein RH, Underwood SR, Rees RS, Longmore DB. In vivo validation of MR velocity imaging. J Comput Assist Tomogr. 1987;11(5):751–756. doi: 10.1097/00004728-198709000-00001. [DOI] [PubMed] [Google Scholar]
- 3.Walker PG, Oyre S, Pedersen EM, Houlind K, Guenet FS, Yoganathan AP. A new control volume method for calculating valvular regurgitation. Circulation. 1995;92(3):579–586. doi: 10.1161/01.cir.92.3.579. [DOI] [PubMed] [Google Scholar]
- 4.Sakuma H, Blake LM, Amidon TM, O’Sullivan M, Szolar DH, Furber AP, Bernstein MA, Foo TK, Higgins CB. Coronary flow reserve: noninvasive measurement in humans with breath-hold velocity-encoded cine MR imaging. Radiology. 1996;198(3):745–750. doi: 10.1148/radiology.198.3.8628864. [DOI] [PubMed] [Google Scholar]
- 5.Ehman RL, Felmlee JP. Adaptive technique for high-definition MR imaging of moving structures. Radiology. 1989;173(1):255–263. doi: 10.1148/radiology.173.1.2781017. [DOI] [PubMed] [Google Scholar]
- 6.Nagel E, Bornstedt A, Hug J, Schnackenburg B, Wellnhofer E, Fleck E. Noninvasive determination of coronary blood flow velocity with magnetic resonance imaging: comparison of breath-hold and navigator techniques with intravascular ultrasound. Magn Reson Med. 1999;41(3):544–549. doi: 10.1002/(sici)1522-2594(199903)41:3<544::aid-mrm17>3.0.co;2-s. [DOI] [PubMed] [Google Scholar]
- 7.Peng HH, Bauer S, Huang TY, Chung HW, Hennig J, Jung B, Markl M. Optimized parallel imaging for dynamic PC-MRI with multidirectional velocity encoding. Magn Reson Med. 2010;64(2):472–480. doi: 10.1002/mrm.22432. [DOI] [PubMed] [Google Scholar]
- 8.Markl M, Kilner PJ, Ebbers T. Comprehensive 4D velocity mapping of the heart and great vessels by cardiovascular magnetic resonance. J Cardiovasc Magn Reson. 2011;13:7. doi: 10.1186/1532-429X-13-7. [DOI] [PMC free article] [PubMed] [Google Scholar]
- 9.Baltes C, Kozerke S, Hansen MS, Pruessmann KP, Tsao J, Boesiger P. Accelerating cine phase-contrast flow measurements using k-t BLAST and k-t SENSE. Magn Reson Med. 2005;54(6):1430–1438. doi: 10.1002/mrm.20730. [DOI] [PubMed] [Google Scholar]
- 10.Stadlbauer A, van der Riet W, Globits S, Crelier G, Salomonowitz E. Accelerated phase-contrast MR imaging: comparison of k-t BLAST with SENSE and Doppler ultrasound for velocity and flow measurements in the aorta. J Magn Reson Imaging. 2009;29(4):817–824. doi: 10.1002/jmri.21706. [DOI] [PubMed] [Google Scholar]
- 11.Jung B, Honal M, Ullmann P, Hennig J, Markl M. Highly k-t-space-accelerated phase-contrast MRI. Magn Reson Med. 2008;60(5):1169–1177. doi: 10.1002/mrm.21764. [DOI] [PubMed] [Google Scholar]
- 12.Adluru G, Awate SP, Tasdizen T, Whitaker RT, Dibella EV. Temporally constrained reconstruction of dynamic cardiac perfusion MRI. Magn Reson Med. 2007;57(6):1027–1036. doi: 10.1002/mrm.21248. [DOI] [PubMed] [Google Scholar]
- 13.Adluru G, McGann C, Speier P, Kholmovski EG, Shaaban A, Dibella EV. Acquisition and reconstruction of undersampled radial data for myocardial perfusion magnetic resonance imaging. J Magn Reson Imaging. 2009;29(2):466–473. doi: 10.1002/jmri.21585. [DOI] [PMC free article] [PubMed] [Google Scholar]
- 14.Thunberg P, Karlsson M, Wigstrom L. Comparison of different methods for combining phase- contrast images obtained with multiple coils. Magn Reson Imaging. 2005;23(7):795–799. doi: 10.1016/j.mri.2005.06.002. [DOI] [PubMed] [Google Scholar]
- 15.Pruessmann KP, Weiger M, Bornert P, Boesiger P. Advances in sensitivity encoding with arbitrary k-space trajectories. Magn Reson Med. 2001;46(4):638–651. doi: 10.1002/mrm.1241. [DOI] [PubMed] [Google Scholar]


