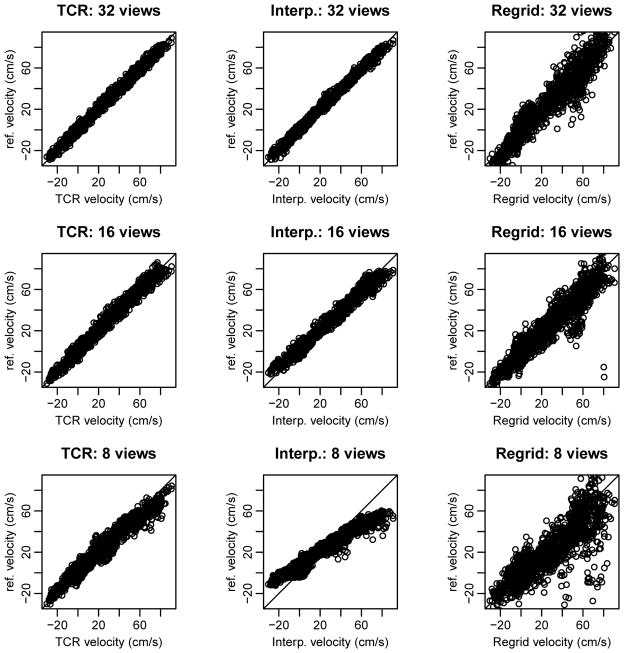
Figure 3.
Correlation plots for one simulated data set under-sampled to 32, 16, and 8 radial views. Plots for TCR are shown on the left, plots for temporal interpolation are shown in the middle, and plots for zero-filled re-gridding are shown on the right. TCR maintains better correlation than temporal interpolation as the number of radial views is decreased, both show better correlation than simple re-gridding.

