Figure 4.

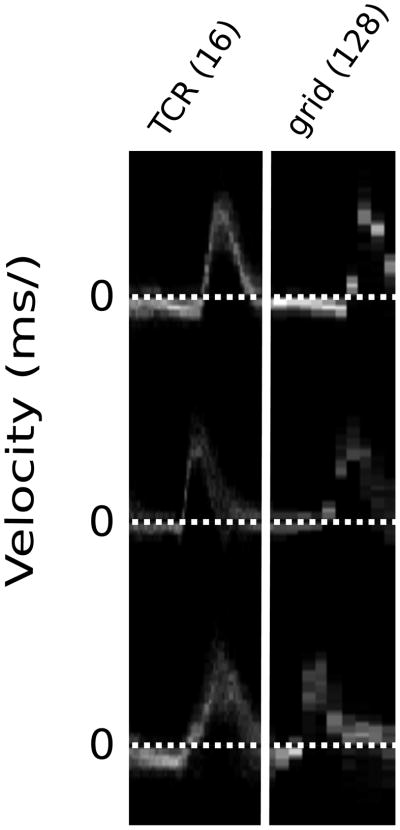
Velocity histogram plots for 3 healthy volunteers from a ROI at the center of the proximal ascending aorta. High temporal-resolution TCR (left) is compared to low temporal-resolution gridding (right).

Velocity histogram plots for 3 healthy volunteers from a ROI at the center of the proximal ascending aorta. High temporal-resolution TCR (left) is compared to low temporal-resolution gridding (right).