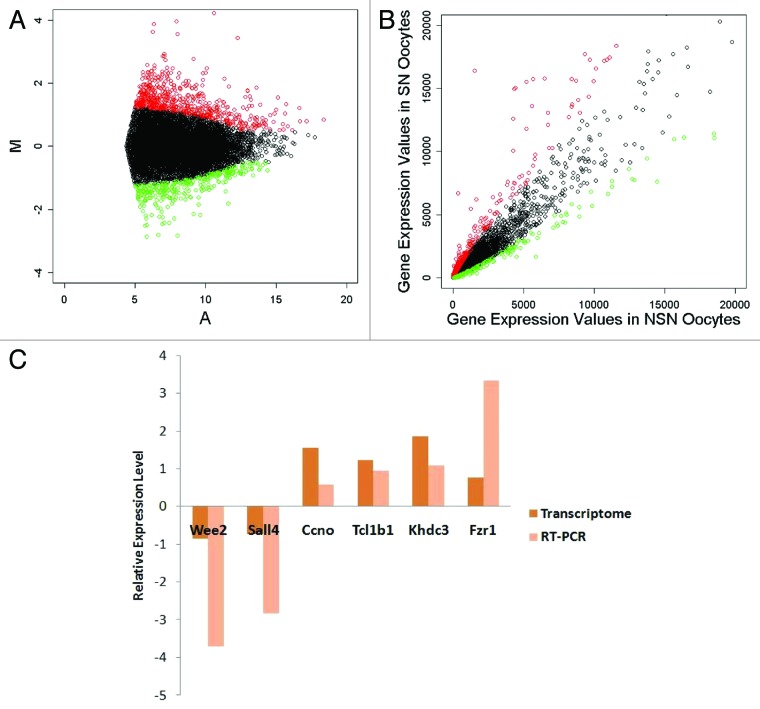
Figure 2. Transcriptome data evaluation and differentially expressed gene selection. (A) MA plot of the transcriptome data. (B) Scatter plot of the transcriptome data. (C) Quantitative RT-PCR evaluation of the transcriptome data, correlation coefficient = 0.79. Red, upregulated genes in SN oocytes; green, downregulated genes in SN oocytes.

An official website of the United States government
Here's how you know
Official websites use .gov
A
.gov website belongs to an official
government organization in the United States.
Secure .gov websites use HTTPS
A lock (
) or https:// means you've safely
connected to the .gov website. Share sensitive
information only on official, secure websites.
