
Figure 1.
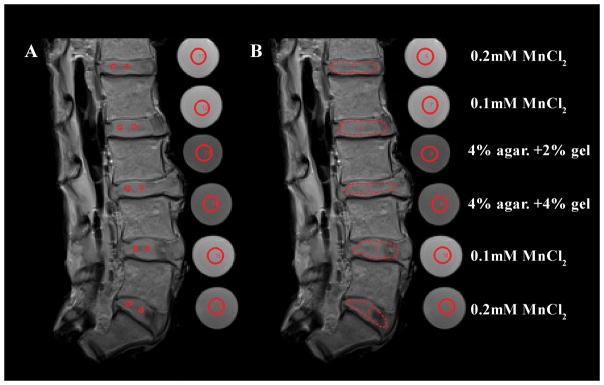
Representative T2 images of the 5-disc human lumbar spines and the four standard solutions used to determine the variability of the MRI technique (0.2 mmol/L MnCl2, 0.1 mmol/L MnCl2, 2% agarose with 2% gelatin, and 4% agarose with 2% gelatin). The regions of interest (ROI) were traced manually as red polygonal shapes with no contact with the endplate tissues and were reproduced identically on all T1, T2, MTR ratio, and diffusion images on all specimens: (A) ROI traced separately for AF and NP; (B) ROI traced for the entire disc.