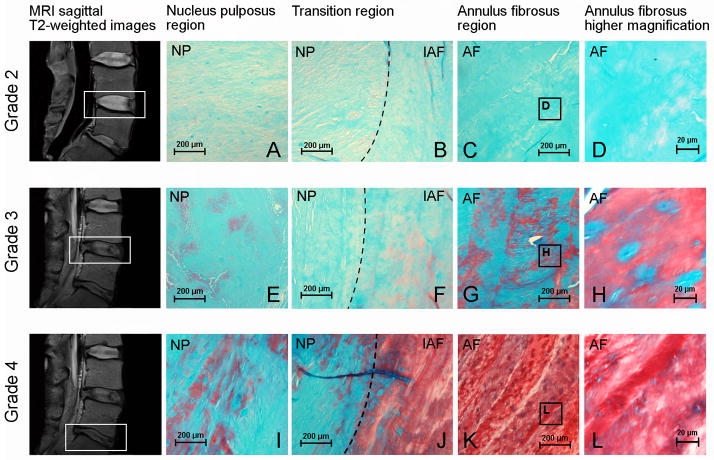
Figure 3.
Histological assessment of human IVDs with different Pfirrmann grades of degeneration. Disc degeneration grading was assessed using MRI sagittal T2-weighted images according to the Pfirrmann scale and histological evaluation was performed using Alcian blue, Safranin-O and fast green staining: (A–D) histological evaluation of IVDs Pfirrmann grade 2, (E–H) histological evaluation of IVDs Pfirrmann grade 3 and (I–L) histological evaluation of IVDs Pfirrmann grade 4; (A, E, I) nucleus pulposus region (objective, 10×); (B, F, J) transition region between nucleus pulposus and annulus fibrosus (objective, 10×); (C, G, K) annulus fibrosus region (objective, 10×) and (D, H, L) higher magnification of the annulus fibrosus region (objective, 20×). Outlined areas on MRI figures indicate IVD degeneration grade 2, 3 and 4 according to the Pfirrmann grading scale. AF = annulus fibrosus, IAF = inner annulus fibrosus (transition region), NP = nucleus pulposus.

