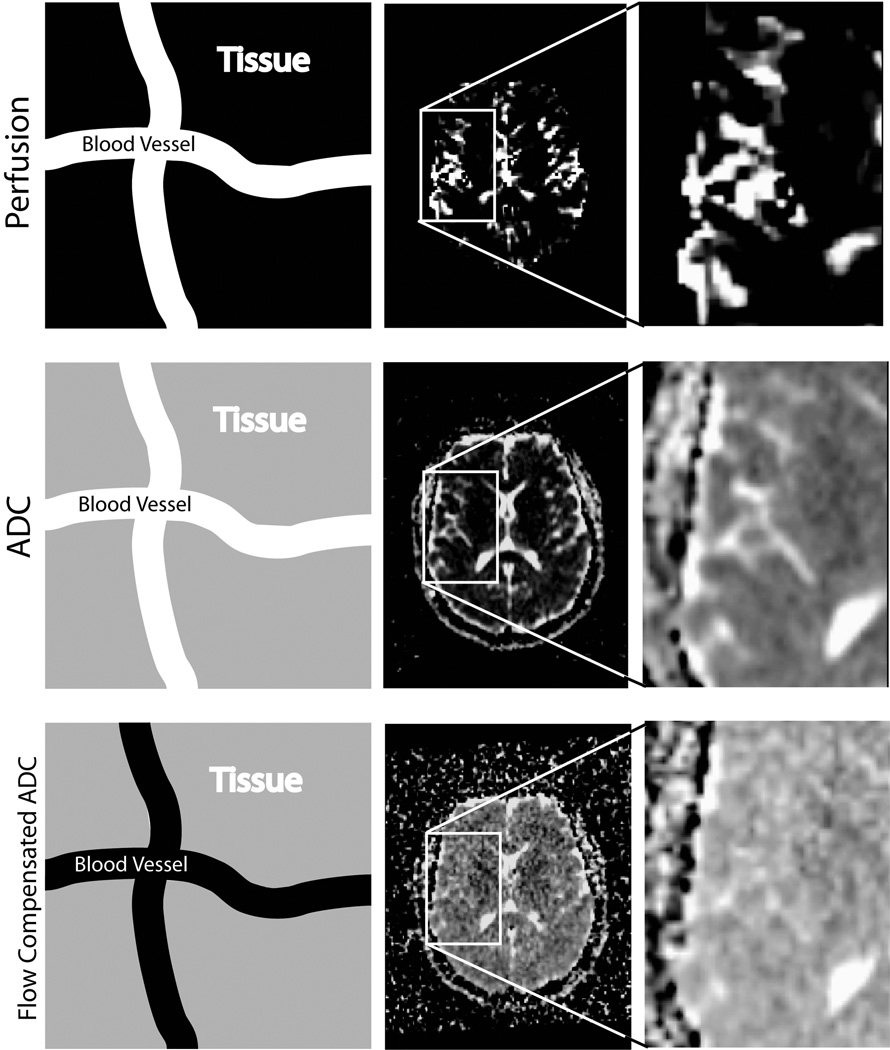
Figure 1.
The use of high b-values in the calculation of ADC reduces perfusion effects. In each row, the first image schematically represents the signal contributions within a voxel. A white color indicates a large contribution to the total signal, black indicates no contribution, and gray an intermediate contribution. The top row shows rCBV maps from one subject. Areas with high blood volume appear white. The middle row shows ADC calculated from b = 0 and 1000 s/mm2. The blood vessels clearly contribute to the ADC value and are seen as high intensity in the ADC map. The bottom row shows flow compensated ADC calculated from b = 500 and 1000 s/mm2. Here, signal from the blood vessels has been suppressed and they are no longer visible on the ADC map.

