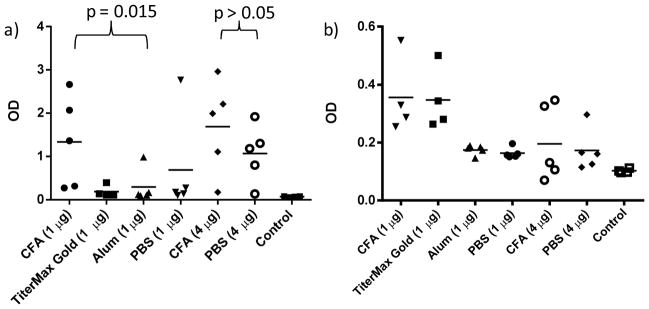
Figure 3.

(A) IgG and (B) IgM responses against Tn antigen in immunized mice with or without exogenous adjuvants. The data shown here are measured at a serum dilution of 1:6400. Each data point represents the optical density at 450 nm measured from serum of individual mice. Lines represent the mean value for each group. Statistical analysis was performed using student t test.
