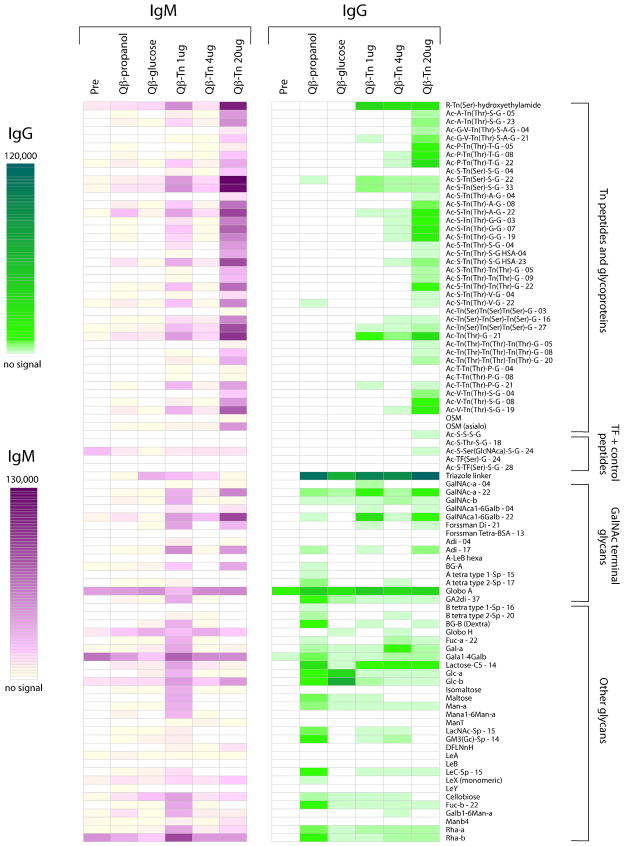
Figure 7.
Glyco-microarray profiles comparing pre- and post-immune sera from various groups of mice. The average fluorescence signals from at least 4 mice per group are presented (IgM data shown in magenta and IgG data shown in green). Glycans are attached to BSA prior to printing on the array surface. The numbers after the glycan abbreviation correspond to the average number of glycans per molecule of albumin [for example, Ac-A-Tn(Thr)-S-G-05 is a neoglycoprotein with an average of 5 Tn peptides per molecule of albumin]. Selected array results are shown and full results can be found in supporting information.

