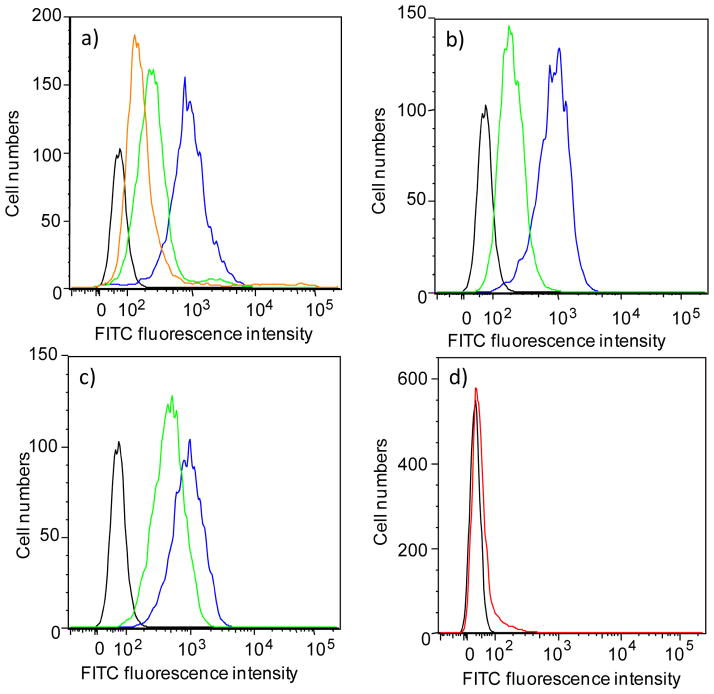
Figure 8.
Flow cytometry analysis of Jurkat cell binding by sera (1:10 dilution) from representative mice immunized with increasing amounts of Qβ-Tn 7 (a) 1 μg Tn, (b) 4 μg Tn, (c) 20 μg Tn, and (d) control mouse immunized with 8. Black curve (negative control) represents the fluorescence obtained with FITC conjugated anti-mouse IgG antibodies in the absence of serum. Colored curves represent results for different mice in the same group.

