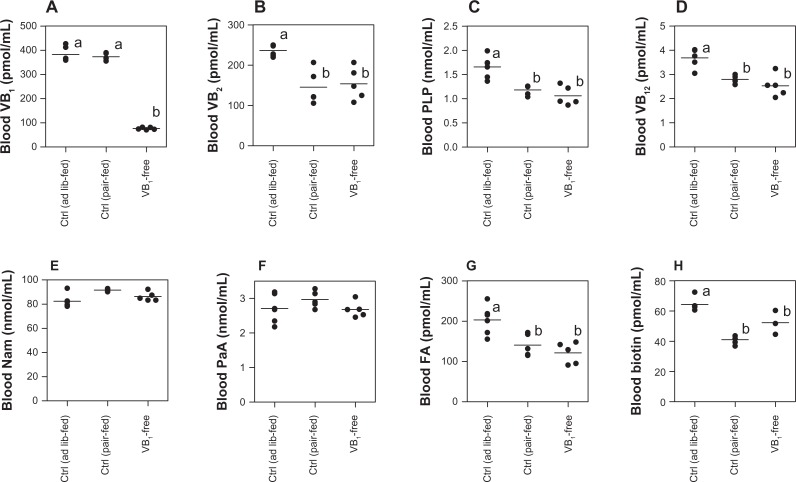
Figure 4.
Comparison of the B-group vitamins of blood among the rats that were fed the control (ad lib-fed), control (pair-fed), and vitamin B1-free diets. (A) Vitamin B1; (B) vitamin B2; (C) vitamin B6; (D) vitamin B12; (E) nicotinamide (Nam); (F) pantothenic acid (PaA); (G) folate (FA); (H) biotin.
Notes: Each dot represents a value for each rat. Horizontal line is the average value of five rats of the same group. Values within the same figure that do not share the same superscripted letters are significantly different by one-way ANOVA with Bonferroni’s multiple comparison tests (P < 0.05).

