
Figure 1.
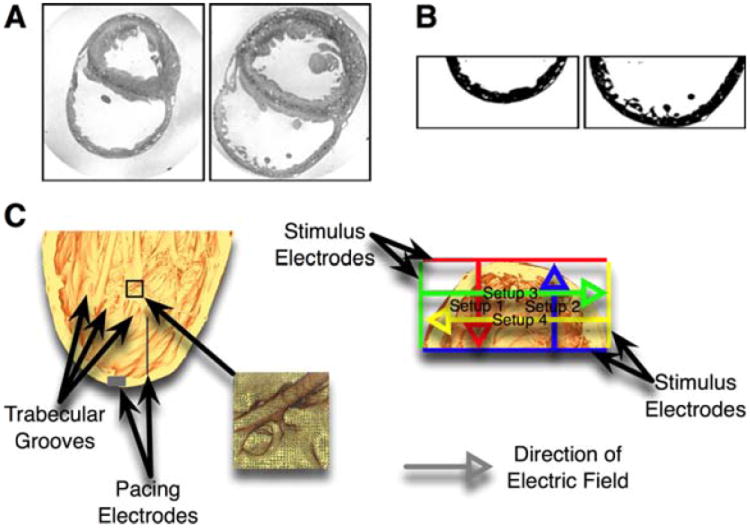
A: Sample MRI slices. Left image taken from apical, right image from basal position. B: The same MRI slices as in panel A after bath removal, segmentation, and cropping of RV wall. C: Long (left) and short (right) axis views of the high-resolution rabbit RV model. Grey boxes mark the pacing electrodes, colored lines mark the far-field electrodes, and colored arrows mark the electric field directions. The long axis view shows the endocardial microstructures (especially trabecular grooves). The inset provides a detailed view of the high-resolution finite-element mesh.