
Figure 5.
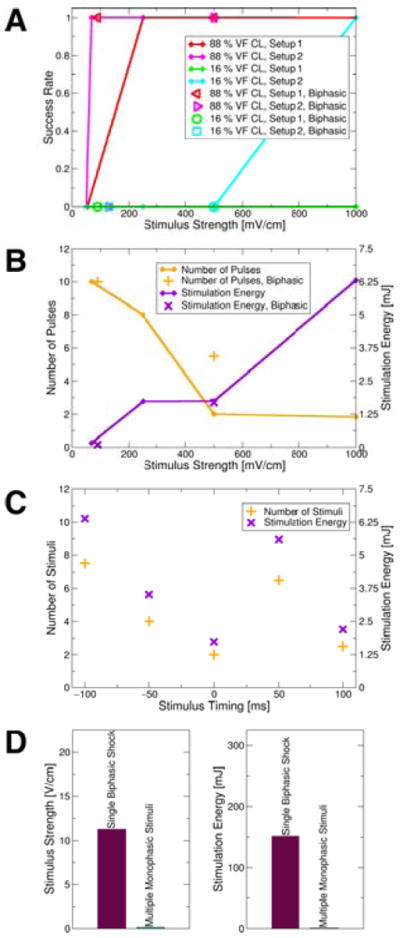
A: Defibrillation success rates for monophasic (lines; data points shown as diamonds) and biphasic (non-diamond symbols) stimuli as a function of stimulus strength and at 16% and 88% of VF CL. B: Mean number of stimuli and stimulation energy required for successful defibrillation attempts (means taken over electrode setups and stimulation rates). Diamonds show data points representing means for monophasic stimuli. C: Mean number of stimuli and mean stimulation energy required for defibrillation attempts at different “phases” of VF after 500mV/cm stimuli administered at 88% VF CL (means taken over electrode setups). Defibrillation was successful regardless of the timing of the initial stimulus. D: Mean DFTs of single biphasic shocks and of multiple low-voltage monophasic stimuli (means over electrode setups).