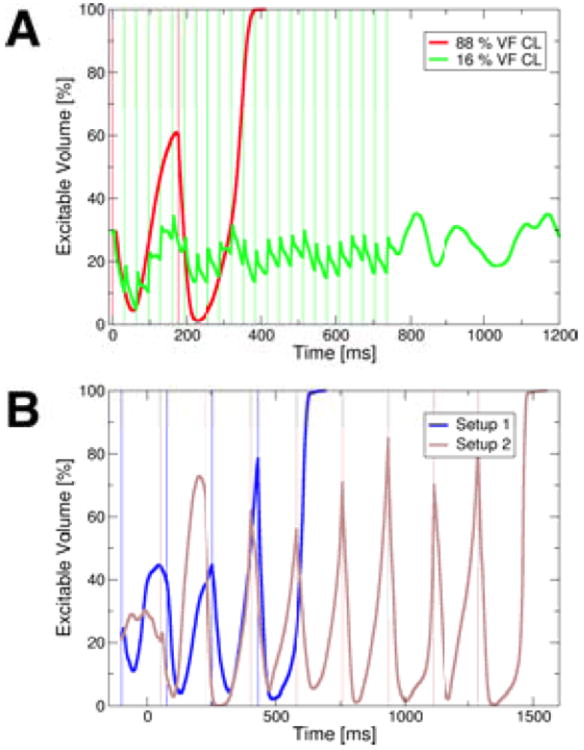
Figure 6.

A: The volume of excitable tissue (measured as percentage of excitable nodes in the mesh) during successful defibrillation at 88% VF CL (red) and failed defibrillation at 16% VF CL (green) after 500mV/cm stimuli given from electrode setup 2. Thin vertical lines mark onsets of stimuli. B: The excitable volume during successful 500mV/cm, 88% VF CL defibrillation stimuli delivered at different “phases” of VF. The blue line represents excitable volume when the first stimulus was administered from setup 1 100ms earlier than the initial stimuli in the protocols presented in panel A. The brown line marks the excitable volume in the case when the initial stimulus was administered from setup 2 50ms later than the first stimuli in the protocols shown in panel A. Thin vertical lines mark onsets of stimuli.
