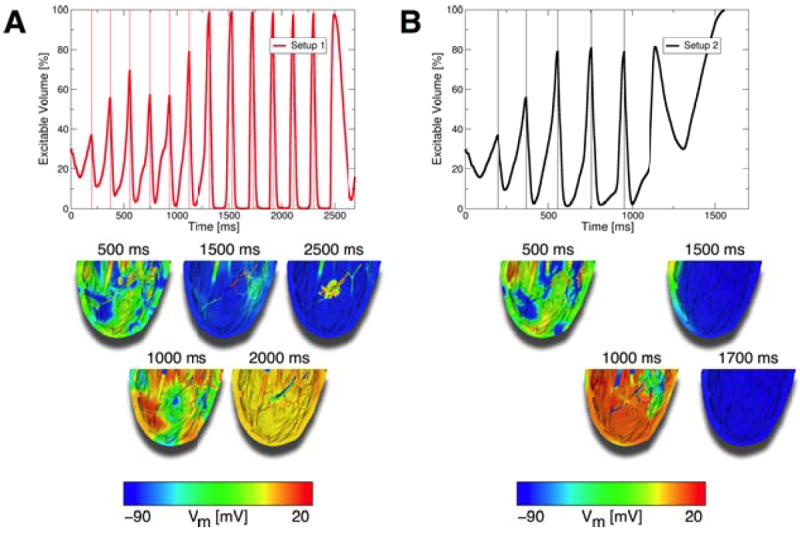
Figure 7.

A: Top panel: The excitable volume during a defibrillation attempt from electrode setup 1 where 250mV/cm stimuli were delivered at timings when the amount of excitable tissue was maximal. Lower panels: Vm maps of defibrillation attempt. VF was converted to VT with these appropriately timed stimuli, but VT remained stable and did not terminate. B: Top panel: Excitable volume during defibrillation attempt from electrode setup 2 where 250mV/cm stimuli were delivered at timings when the excitable tissue was maximal. Lower panels: Vm maps of defibrillation attempt. VF was converted to VT, and VT was then terminated with additional stimuli from setup 2. Thin vertical lines in top panels mark onsets of stimuli.
