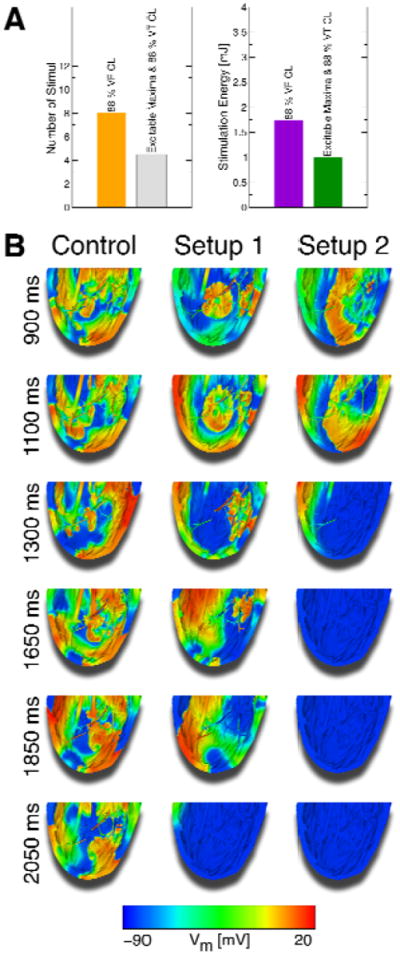
Figure 8.

A: Comparison of the mean number of stimuli and energy required for successful defibrillation following 250mV/cm stimuli at 88% VF CL and using the two-stage defibrillation protocol (means taken over electrode setups). B: Vm maps of successful defibrillation with the two-stage defibrillation protocol compared to control Vm maps. With this two-stage defibrillation protocol, VF was converted into VT, which was then successfully terminated.
