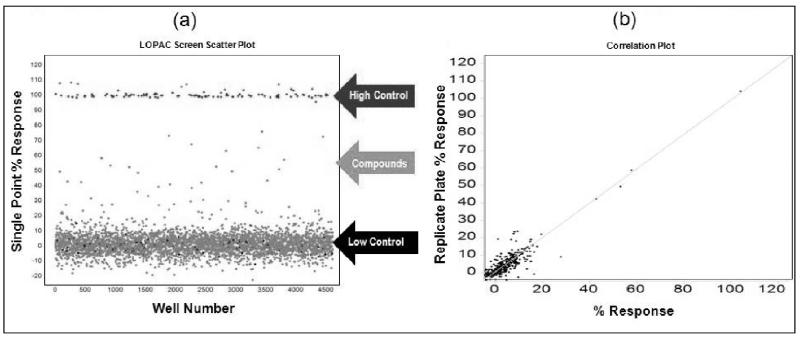
Fig. 3. Scatter plot analysis of the high-throughput LOPAC pilot screen.
(a) All data from all assay plates (n=17, triplicate results), including controls, are displayed. Large separation in activity (Z’ =0.85 ± 0.05, S/B=7.3 ± 0.6) between wells dosed with SR121463 (“high control”) and DMSO (“low control”), as well as a broad distribution of hits indicate an excellent HTS assay. (b) Representative graph of compound activity correlating plate replicas. The best fit line has an r2=0.86, indicative of the high fidelity of the no-wash assay hit identification.

