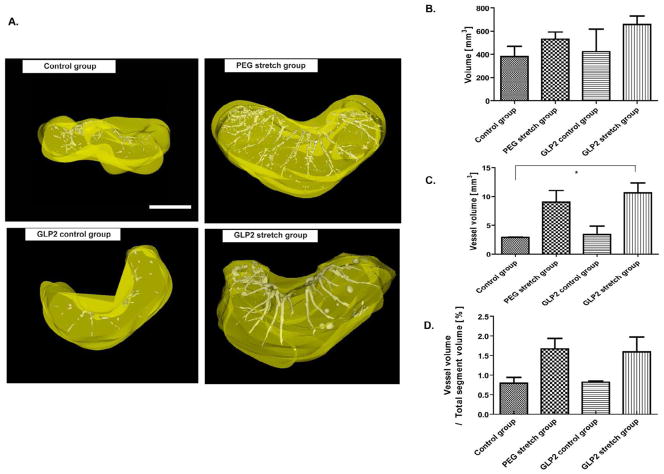
Figure 4. Analysis of vascularization.
A. Representative images of the 3 dimension reconstructions of the vascularization of isolated segments from each study group as reconstructed using Microview software. The white colored area indicates the vessel structure. Likewise yellow color area indicates intestinal volume. Scale bar is 0.5mm.
B. Summary of the changes in intestinal volume in each study group. Although there was no significant change, a trend of increased volume was observed in the PEG stretch and GLP-2 stretch groups, with the largest volume in the GLP-2 stretch group.
C. Mean vessel volume, the GLP-2 stretch group led to a statistically significant increase in vessel volume compared to the Control group (*p<0.05).
D. The ratio of vessel volume to total intestinal segment size is shown. Not a marked increase in this ratio for both the PEG stretch and GLP-2 stretch groups. (p=0.87)
Values are means ± SEM.

