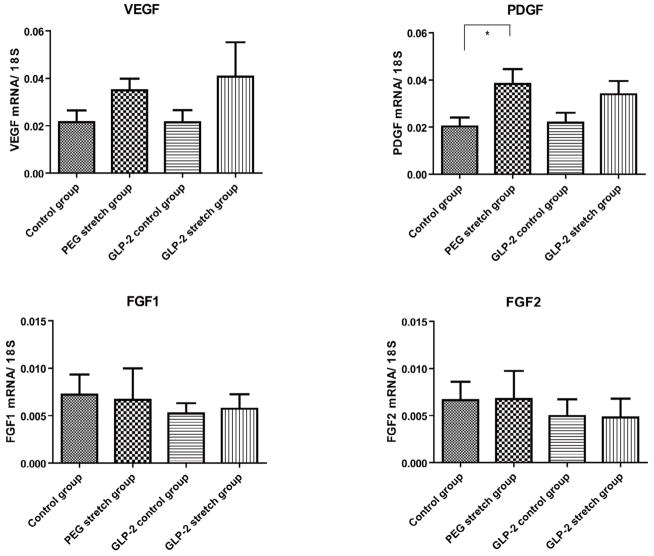
Figure 5. Vascularity associated gene expression.
Mucosally-derived mRNA expression of several vascularization-associated control genes were studied with RT-PCR and expressed as a ratio to 18S RNA. Note that the abundance of each of these factors rose in the PEG stretch group. Interestingly, the addition of GLP-2 actually led to a reduction of these values for FGF1 and FGF2. The only significant change was the expression of PDGF between the PEG stretch and Control groups (p<0.05). Other changes were not statistically different between these two groups (VEGF; p=0.20, FGF1; p=0.18, FGF2; p=0.55). Values are means ± SEM.

