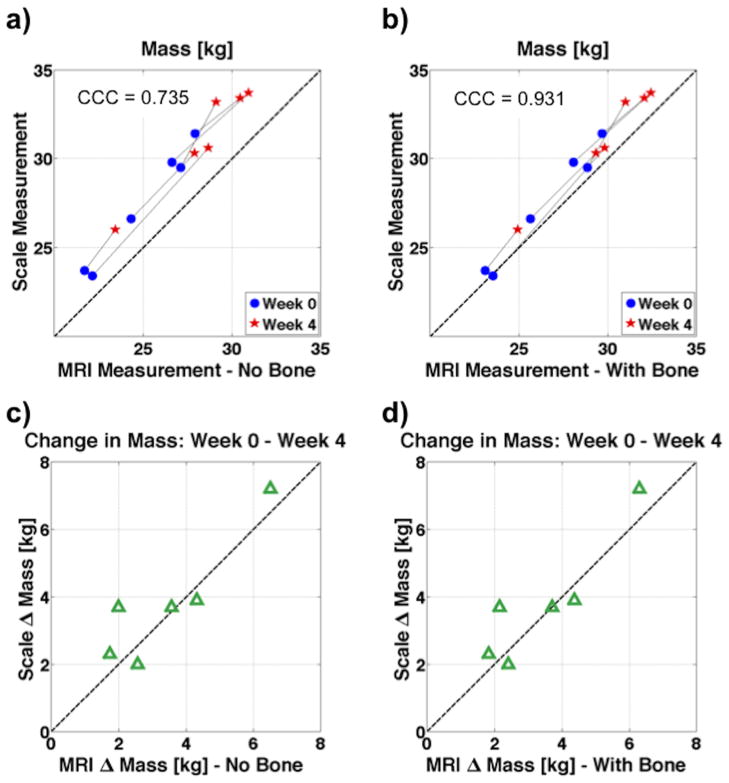
Figure 3.
Plots correlating the mass of all six dogs as measured on the scale to MRI derived mass. The MRI derived mass is calculated both without taking bone into account in panels a) and b), as well as with bone in panels c) and d). When bone is included, the MRI mass falls closer to the line of unity, and the concordance correlation coefficient (CCC) increases from 0.735 to 0.931.

