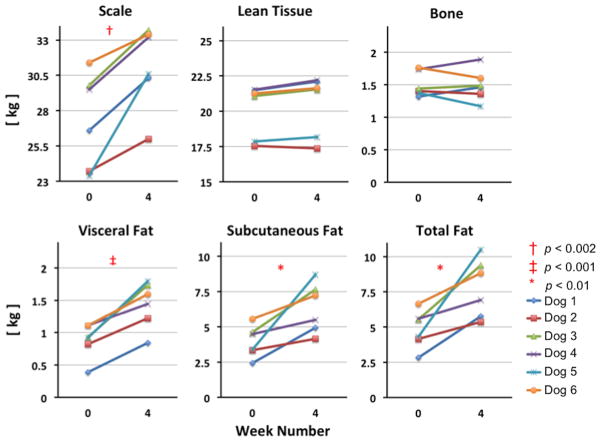
Figure 4.
Plots of the change from week 0 to week 4 in total mass (measured on the scale) as well as tissue masses derived from MRI segmented tissue volumes, and converted to mass using appropriate densities. As expected, the visceral adipose mass, subcutaneous adipose tissue mass, total fat mass and the total mass are all significantly increased at week 4.

