
Figure 2. Immunoblot analysis of protein expression of glutamate transporters reveals that GLT-1 and EAAC1 were significantly decreased in the striatum of 12 week-old R6/2 mice compared to WT mice.
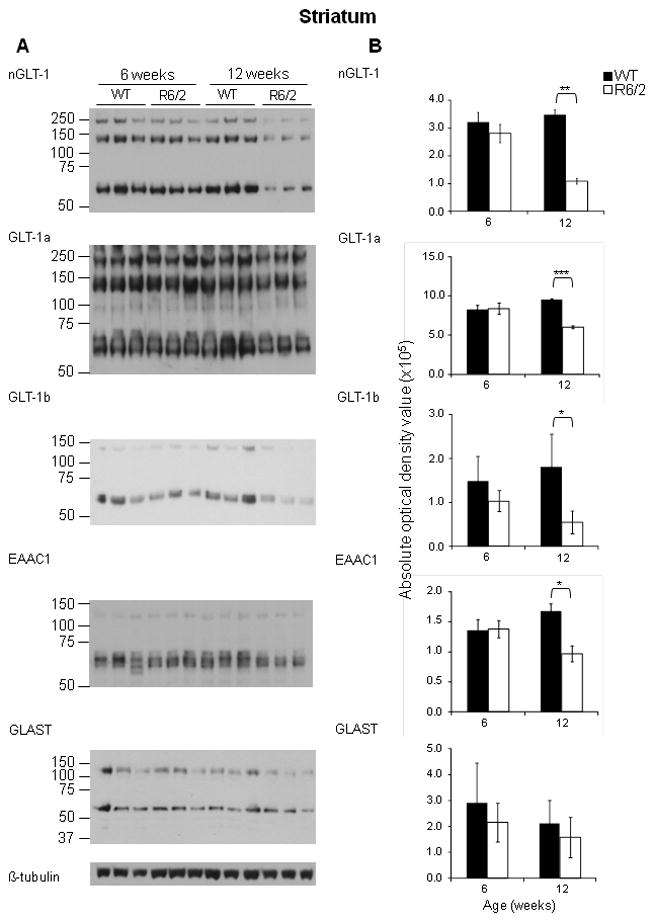
A - Immunoblot analysis using nGLT-1, GLT-1a, GLT-1b, EAAC1, GLAST and β-tubulin antibodies on lysates from the striatum of 12 week old WT and R6/2 mice; GLT-1+/− mice. B – Quantification of the protein expression of total GLT-1, GLT-1a, GLT-1b, EAAC1 and GLAST expression in the striatum of 6 and 12 week-old WT and R6/2 mice. Histograms showing the average absolute optical density, indicative of protein expression of total GLT-1, GLT-1a, GLT-1b, EAAC1 and GLAST in the cortex of three 12 week old WT (solid black) and R6/2 mice (solid white). *P< 0.05, **P < 0.01 (One-way ANOVA followed by Bonferroni’s post hoc test); ±SD; n=3.