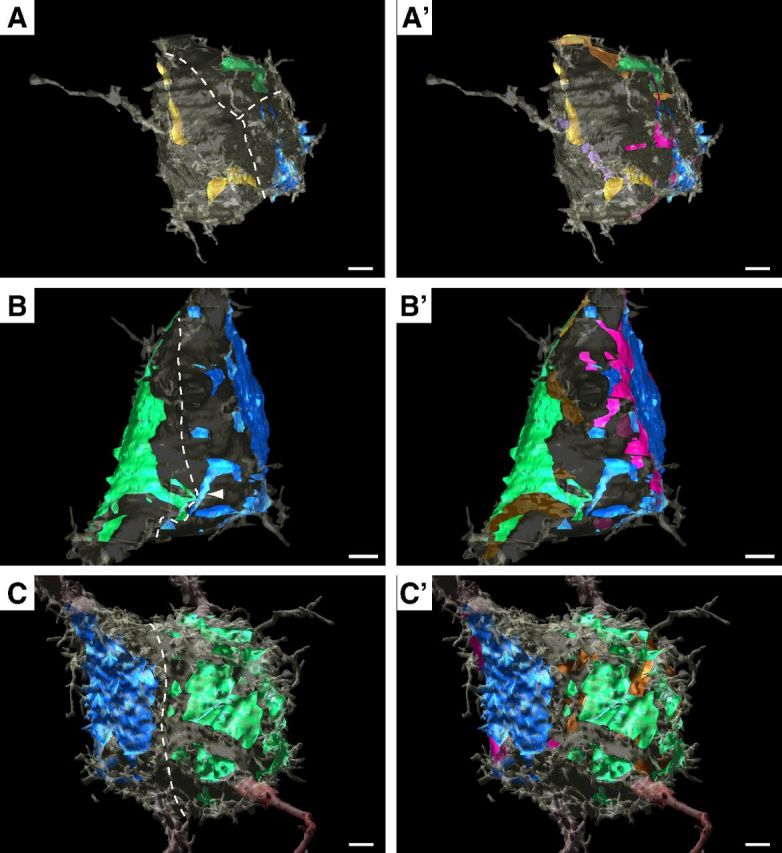
Figure 10.

Competing inputs innervate distinct domains on MNTB somatic surface. A–C, Dotted lines hand drawn to illustrate well segregated innervation territories. Inputs increase in size from A to C. As in other figures, largest input blue, second largest green, third largest yellow. A'–C', Inputs are segregated even after addition of glial incursions under terminals (maroon for blue terminals; bronze for green terminals; purple for yellow terminal). Cell in A' has green input and associated glial incursions located on opposite side of cell body, which is translucent, giving the illusion of overlap with maroon glial incursion. A–B', P3 cells; C, C', P6 cell. Scale bars, 2 μm.
