Figure 8.
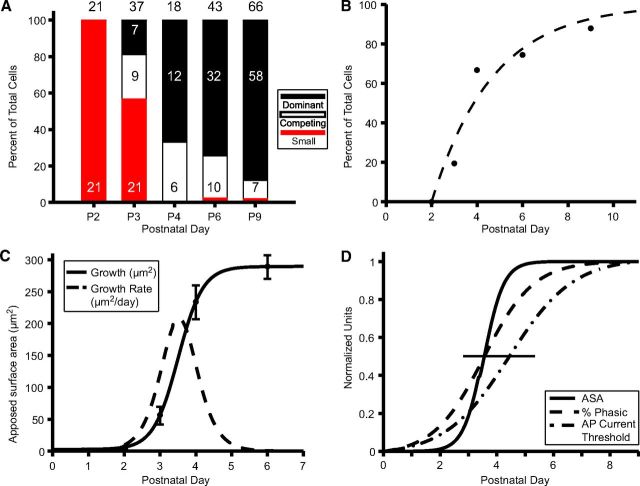
Competition and population growth dynamics of calycigenic terminals. A, Summary histograms of nerve terminal growth by prevalence of MNTB cells with inputs in the categories of (1) only small terminals (red), (2) actively competing large terminals (open; size ratio, <5), and (3) a dominant large input (black; size ratio, >5). Numbers of cells analyzed at each age indicated above histograms. B, Dynamics for emergence of a dominant large input. Exponential fit with τ = 2.7 d, R2 = 0.94. C, Population growth dynamics for calyx-forming inputs. Data points are average of the largest terminal onto each reconstructed cell between P2 and P6; size of largest input at P9 was assessed qualitatively for most cells. At P6, cells with inputs <75 μm2 excluded from analysis as these likely formed a distinct population (see Results for P6 and P9). Data were fitted to a Boltzmann function as described in Materials and Methods. Slope of curve reveals growth rate, which peaks at 207 μm2/d. D, Coordinated time scales for calyx growth (Boltzmann fit from C, solid line), transition of AP firing phenotype from tonic to phasic (dashed line) and increase in AP threshold to current pulse injection (dash-dotted line) from Hoffpauir et al. (2010). Horizontal line indicates half-maximum of normalized ordinate values.

