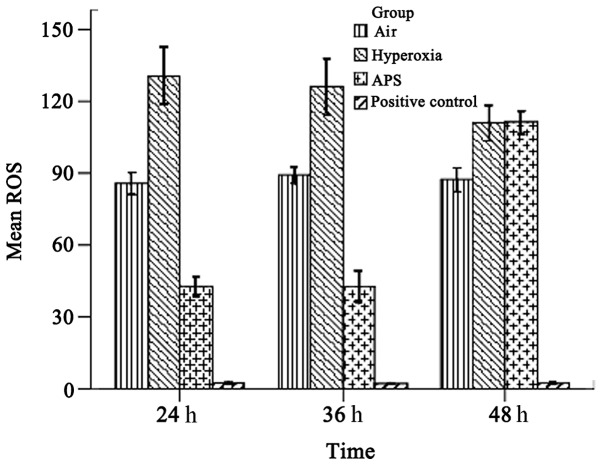
Figure 3.
ROS levels in the air, hyperoxia and APS groups. The ROS level of the hyperoxia group was significantly higher than those of the air and APS groups at 24 and 36 h while the ROS level of the APS group was significantly lower than that of the air group (P<0.01). The ROS level of the air group was significantly lower compared with those of the hyperoxia and APS groups at 48 h, while the difference between the hyperoxia and APS groups was not statistically significant (P>0.05). The ROS level of the APS group at 48 h was significantly higher compared with the ROS level at 24 and 36 h (F=675.247, P<0.01). ROS, reactive oxygen species; APS, astragalus polysaccharides.

