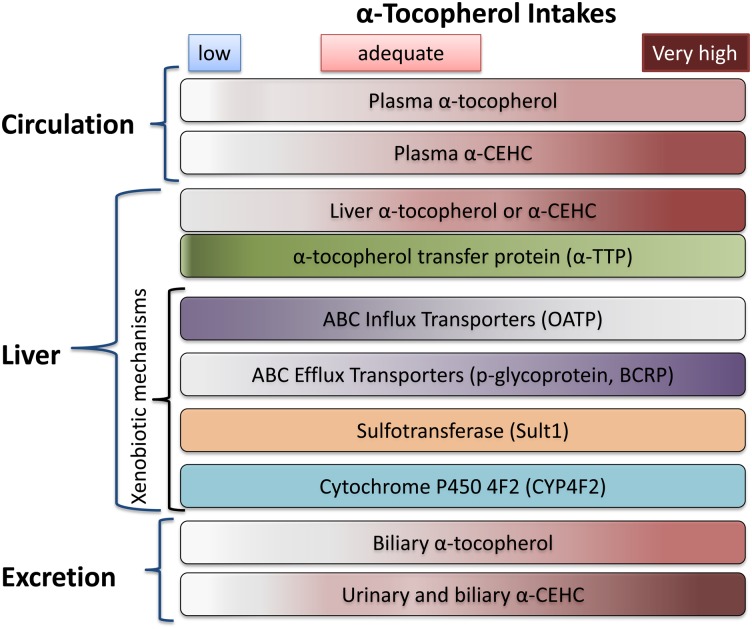
Scheme 1.
Relationship between vitamin E in diet, circulation, liver, and excretion. The α-tocopherol and α-CEHC are shown in a rose color, with higher concentrations indicated by darker colors. For all panels, as the vitamin E intake moves from low (<5 mg/day), to adequate (10–50 mg/day), to very high (>1,000 mg/day), the intensity of the color increases. Components with no color change (e.g., α-TTP) do not vary with vitamin E intake. Note that OATP varies inversely with vitamin E intake.

