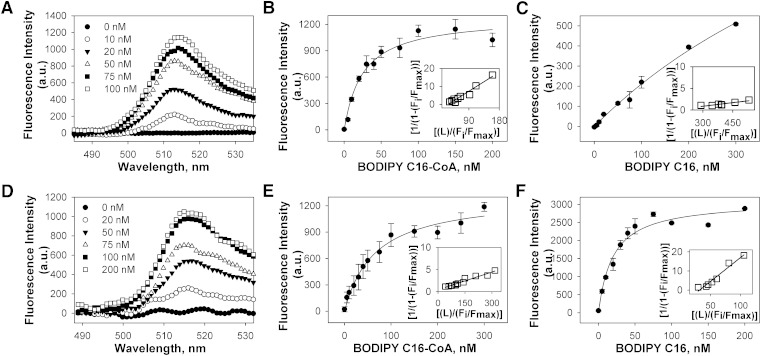
Fig. 2.
(A) Corrected fluorescence emission spectra of 0.1 μM hPPARα titrated with 0 (filled circles), 10 (open circles), 20 (filled triangles), 50 (open triangles), 75 (filled squares), and 100 nM (open squares) of BODIPY C16-CoA upon excitation at 465 nm, demonstrating increased fluorescence intensity upon binding to hPPARα. Plot of hPPARα maximal fluorescence emission as a function of BODIPY C16:0-CoA (B) and BODIPY C16:0 FA (C). (D) Corrected fluorescence emission spectra of 0.1 μM mPPARα titrated with 0 (filled circles), 20 (open circles), 50 (filled triangles), 75 (open triangles), 100 (filled squares), and 200 nM (open squares) of BODIPY C16-CoA upon excitation at 465 nm, demonstrating increased fluorescence intensity upon binding to mPPARα. Plot of mPPARα maximal fluorescence emission as a function of BODIPY C16:0-CoA (E) and BODIPY C16:0 FA (F). Insets represent linear plots of the binding curve from each panel. All values represent the mean ± SE, n ≥ 3.

