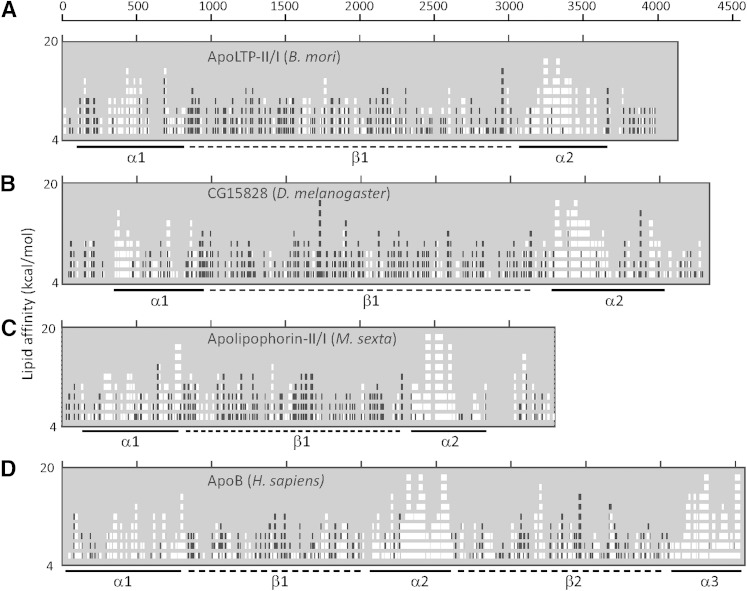
Fig. 3.
Predictions of amphipathic clusters within apoLTP-II/I. Individual panels show the results of LOCATE analyses of (A) B. mori apoLTP II/I, (B) D. melanogaster CG15828 protein, (C) M. sexta precursor protein of lipophorin, and (D) H. sapiens apoB. Numbers on the x-axis indicate the residue number of each amino acid sequence. The y-axis indicates the lipid affinity value, which varied from 4.0 to 20 kcal/mol. Regions of the predicted amphipathic α-helix with high lipid affinity are indicated with white boxes in the graph and solid bars below the graph (α), and the regions of predicted amphipathic β-strands with high lipid affinity are indicated with black boxes in the graph and dotted bars below the graph (β).

