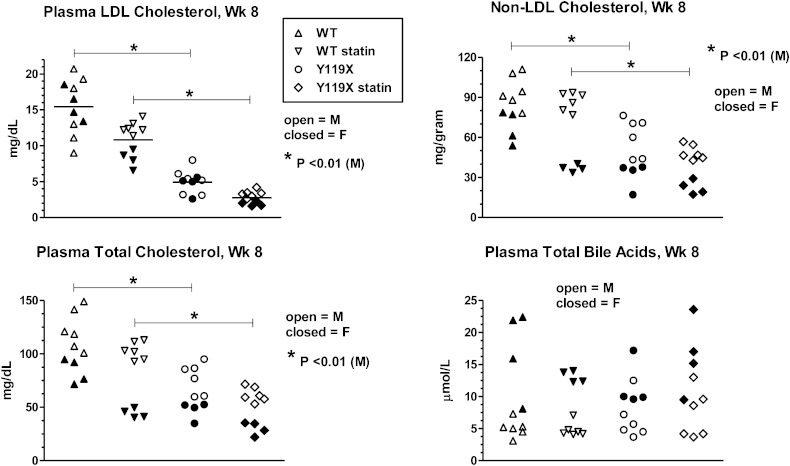
Fig. 3.
Plasma LDL-C, HDL-C, total cholesterol, and total bile acids after 8 weeks atorvastatin. Values for each lipid measured (indicated in titles for each panel) are shown as scatterplots of individual animal data for male mice (M) (closed symbols, n = 6 per group) and female mice (F) (open symbols, n = 4 per group). Bars with asterisk (*) indicate significance for means of male group data analyzed by one-way ANOVA with Bonferroni test for multiple comparisons.

