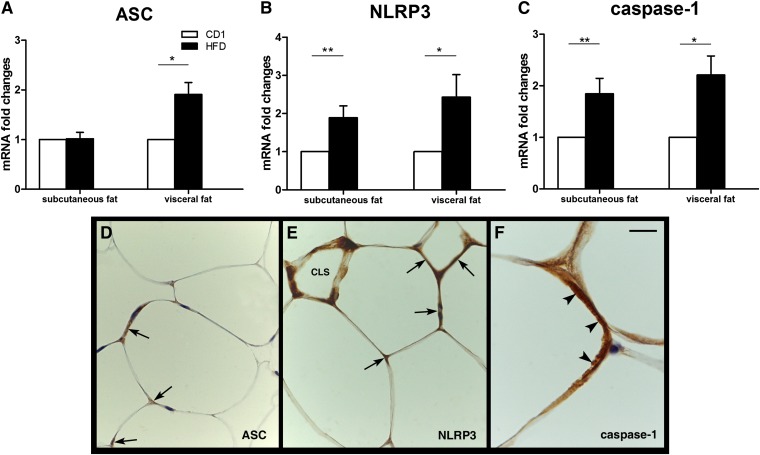
Fig. 10.
NLRP3 inflammasome activation in HFD obese mouse adipose tissue. Upper panels. RT-PCR analysis of ASC (A), NLRP3 (B), and caspase-1 (C). Mean ± SEM. *P < 0.05; **P < 0.01; ***P < 0.001. Bottom panels. Immunohistochemical detection of NLRP3 markers in the visceral fat of HFD mice. In (D), specific ASC immunostaining can be seen as brownish precipitate in the cytoplasm of hypertrophic adipocytes (arrows). In (E), NLRP3 is found in some hypertrophic adipocytes (arrows) and in a CLS. In (F), a hypertrophic adipocyte exhibits strong cytoplasmic staining for caspase-1 (arrowheads). Scale bar: 20 μm for (D) and (E); 7 μm for (F).

