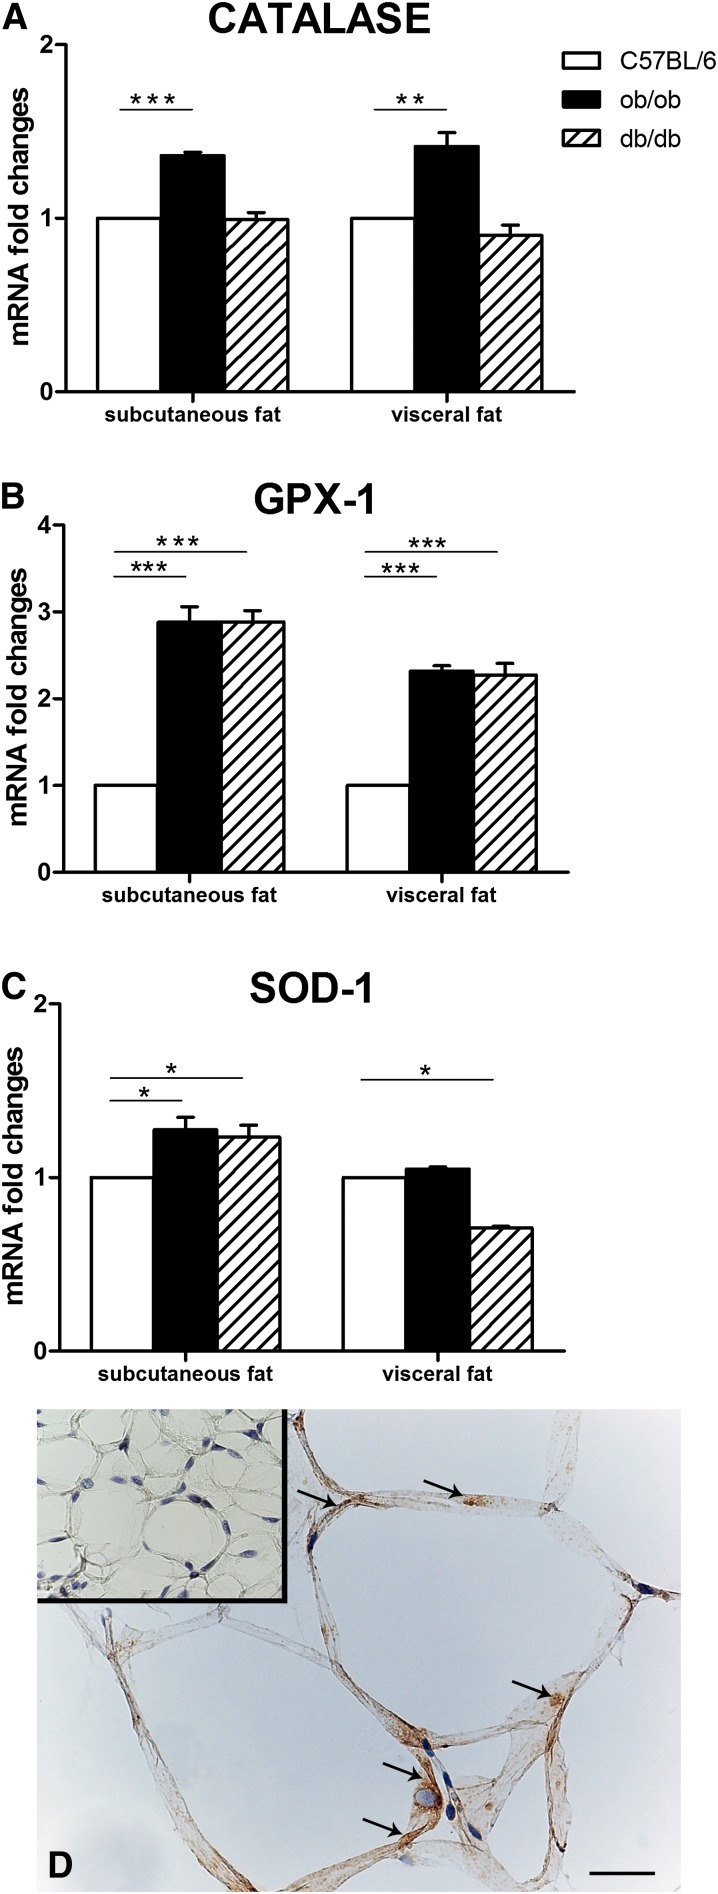
Fig. 5.
Expression and distribution of anti-reactive oxygen species enzymes in the subcutaneous and visceral fat of genetically obese mice. RT-PCR analysis of catalase (A), glutathione peroxidase-1 (GPX-1) (B), and superoxide dismutase-1 (SOD-1) (C). By immunohistochemistry, catalase is detectable in the cytoplasm (arrows) of hypertrophic adipocytes from the visceral fat of a db/db mouse (D), while a control mouse [inset of (D)] does not show specific staining. Mean ± SEM. *P < 0.05; *P < 0.01; *** P < 0.001. Scale bar: 37 μm for (D); 100 μm for inset of (D).

